Fig. 3.
Download original image
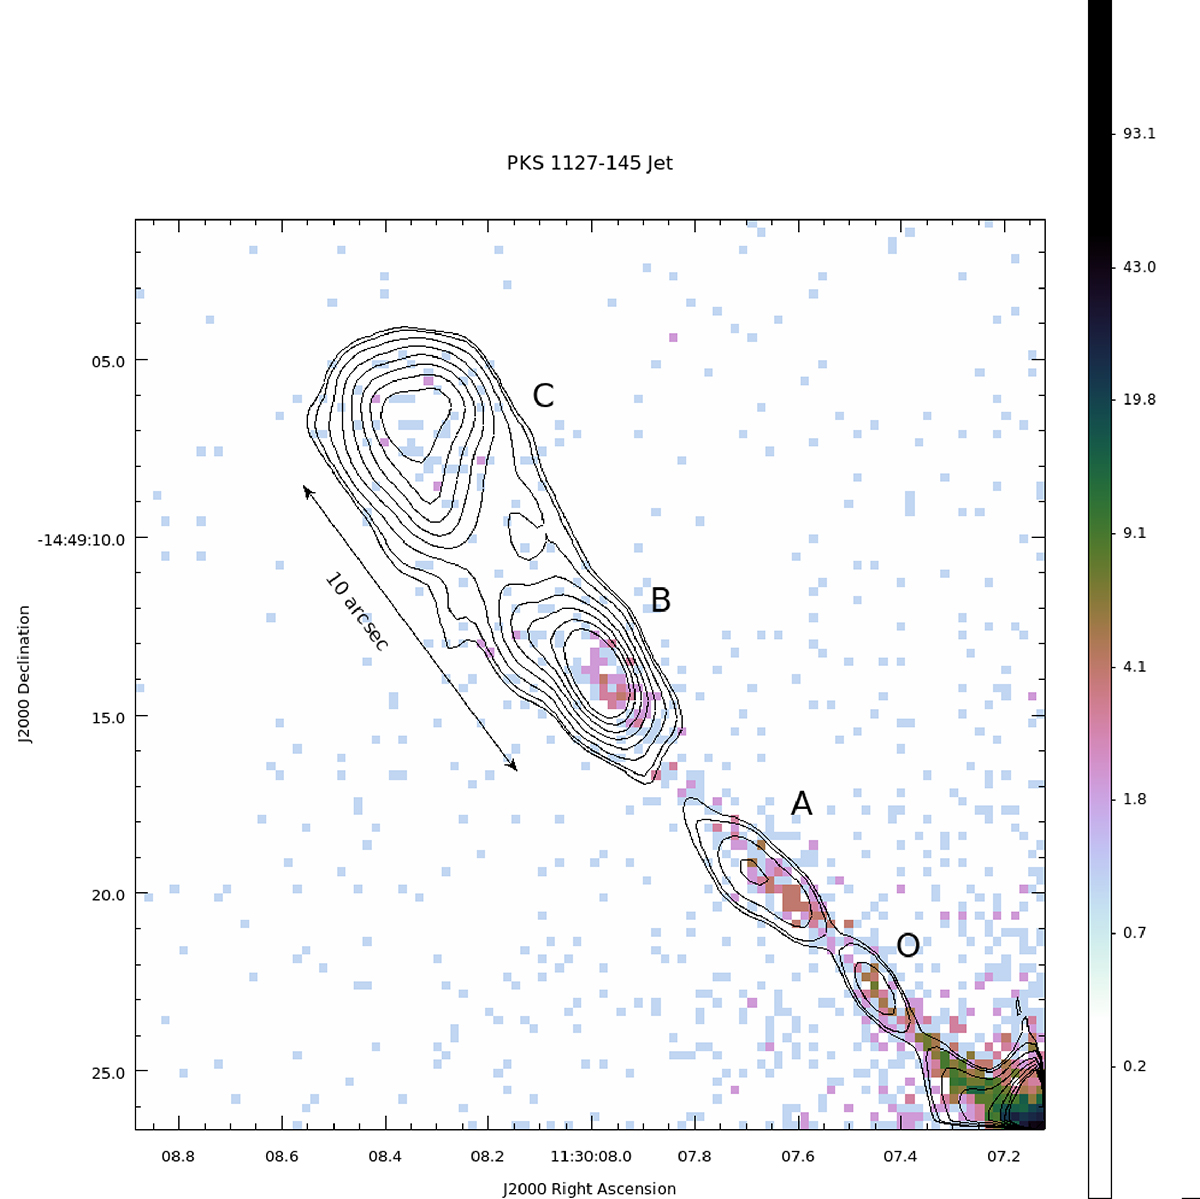
ACIS-S 0.5–7 keV mosaic image binned into 0.246″ pixels (0.5 bin scale). The color bar shows the number of counts per pixel. The black contours are from the 1.6 GHz L-band VLA map starting at 0.45 mJy beam−1 and increasing by ![]() . The main knots are labeled and the arrow marks a 10″ scale along the outer part of the jet. The quasar core is located in the bottom right corner just outside the main frame.
. The main knots are labeled and the arrow marks a 10″ scale along the outer part of the jet. The quasar core is located in the bottom right corner just outside the main frame.
Current usage metrics show cumulative count of Article Views (full-text article views including HTML views, PDF and ePub downloads, according to the available data) and Abstracts Views on Vision4Press platform.
Data correspond to usage on the plateform after 2015. The current usage metrics is available 48-96 hours after online publication and is updated daily on week days.
Initial download of the metrics may take a while.