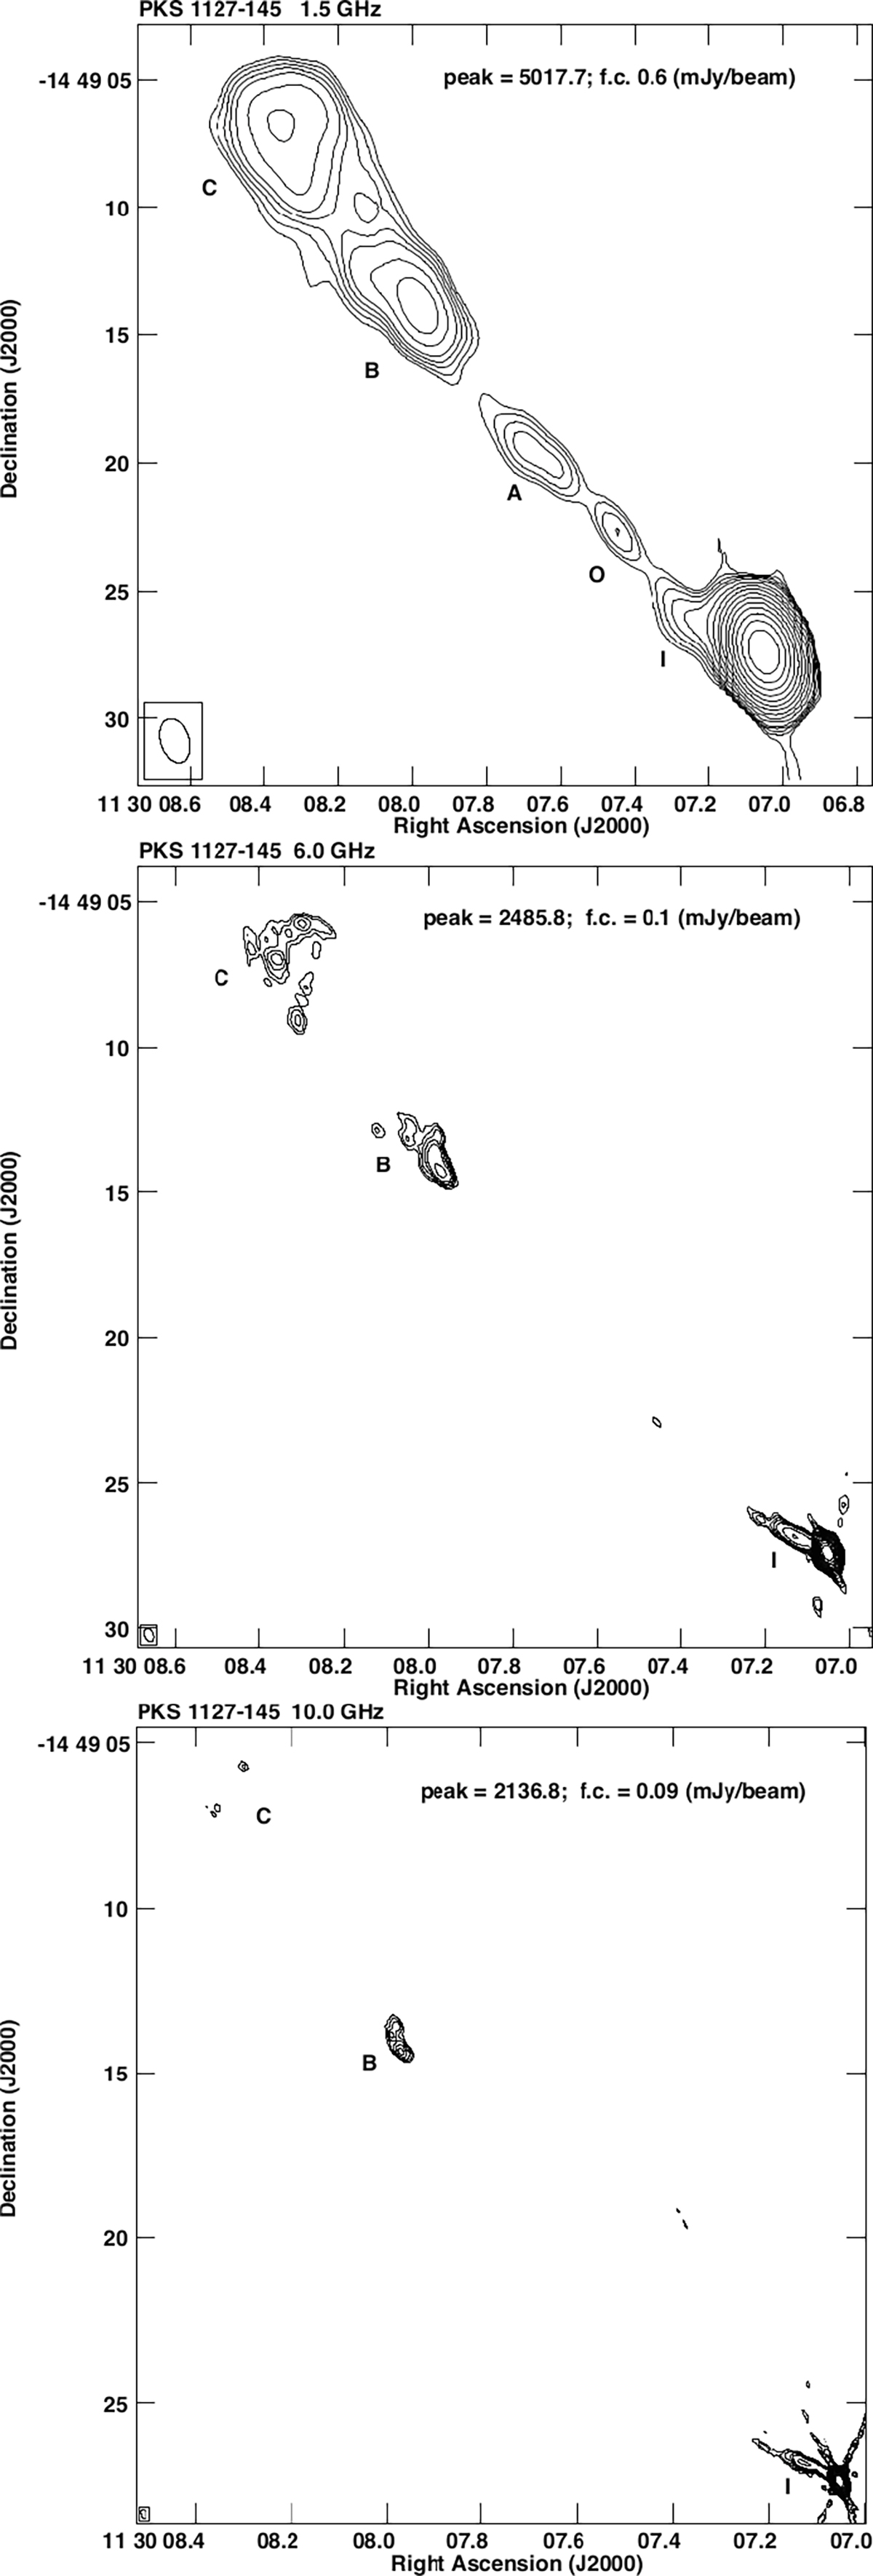
Fig. 1.
Download original image
Total intensity images of PKS 1127−145 at 1.5 GHz (top), 6 GHz (middle), and 10 GHz (bottom). The first contour is 0.6, 0.1, and 0.075 mJy beam−1 at 1.5, 6, and 10 GHz, respectively, and corresponds to three times the rms measured on the image plane close to the center. Contours are drawn at [−1, 1, 1.4, 2, 2.8, 4, 5.6, 8, 16, 32, 64,...] times the first contour. The restoring beam is plotted in the bottom left corner of each image.
Current usage metrics show cumulative count of Article Views (full-text article views including HTML views, PDF and ePub downloads, according to the available data) and Abstracts Views on Vision4Press platform.
Data correspond to usage on the plateform after 2015. The current usage metrics is available 48-96 hours after online publication and is updated daily on week days.
Initial download of the metrics may take a while.