Fig. 7
Download original image
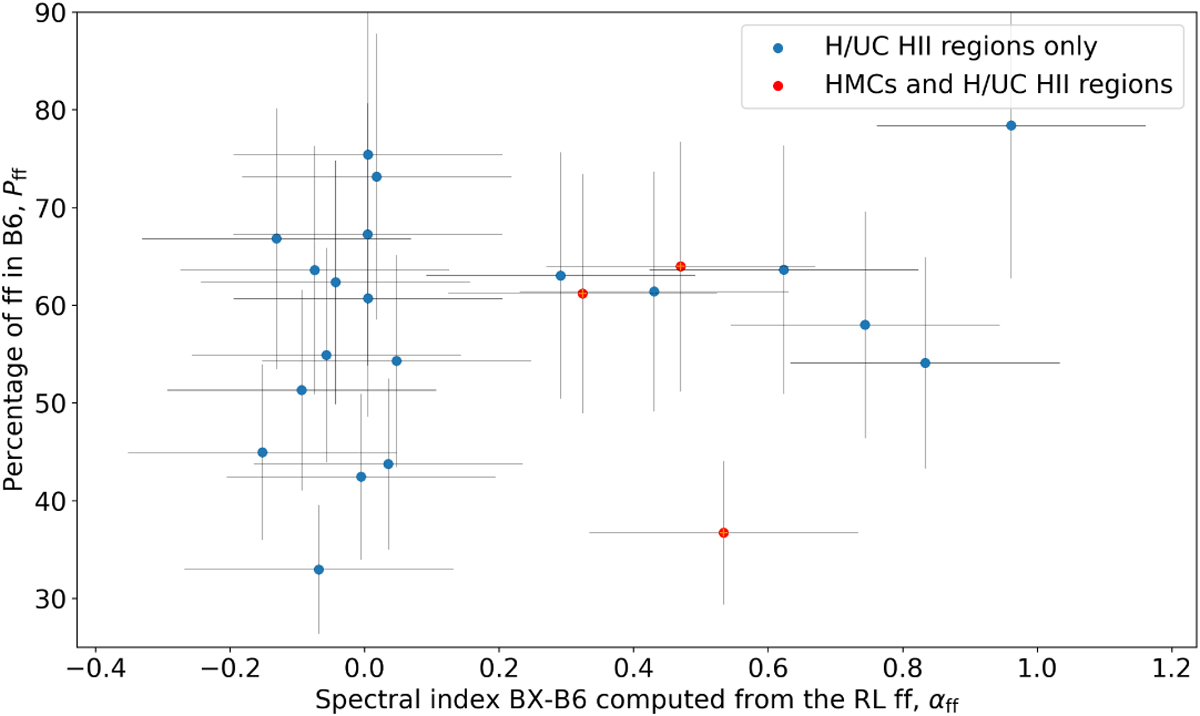
Percentage of free-free emission at 1.3 mm (Pff) as a function of the spectral index of free-free emission (αff). A group of cores with a higher spectral index, αff > 0.2, can be distinguished, but Pff and αff are not anti-correlated. The core sample represented here is made up of 23 cores with H30α and X band detections. Cores with H/UC HII regions and HMCs are shown in red, and cores with H/UC HII regions only are shown in blue.
Current usage metrics show cumulative count of Article Views (full-text article views including HTML views, PDF and ePub downloads, according to the available data) and Abstracts Views on Vision4Press platform.
Data correspond to usage on the plateform after 2015. The current usage metrics is available 48-96 hours after online publication and is updated daily on week days.
Initial download of the metrics may take a while.