Fig. 6
Download original image
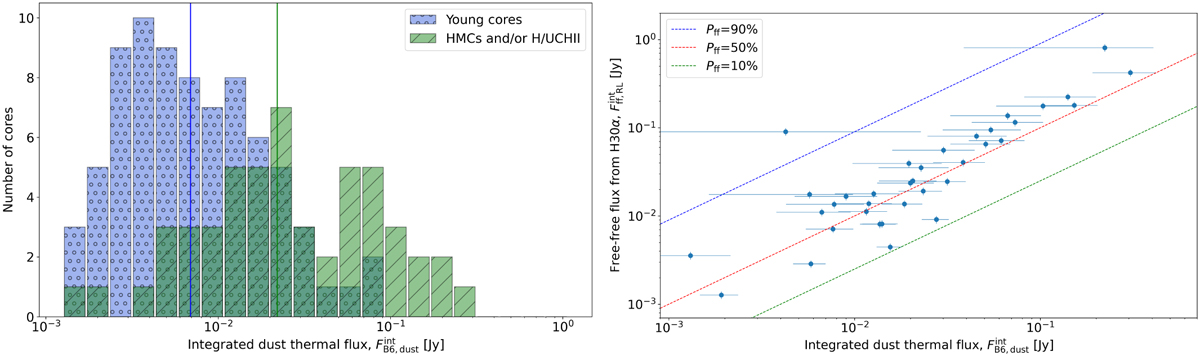
Distribution of the core-integrated dust fluxes shown with a histogram (left) and compared to the distrubution of free-free fluxes (right). Left: cores with an HMC emission and/or an H/UC HII region (stages b to d, shown in green) are compared to the “young cores” without evidence of massive star formation (stage a, shown in blue). The vertical lines represent the median value of the distributions. Right: the core sample in this plot is made of the 35 cores with (robust or tentative) H30α detection, classified as cores with an H/UC HII region. The dashed lines represent constant values of the percentage of free-free emission Pff with respect to the total core flux. Uncertainties were evaluated as 10% of the free-free and B6 fluxes.
Current usage metrics show cumulative count of Article Views (full-text article views including HTML views, PDF and ePub downloads, according to the available data) and Abstracts Views on Vision4Press platform.
Data correspond to usage on the plateform after 2015. The current usage metrics is available 48-96 hours after online publication and is updated daily on week days.
Initial download of the metrics may take a while.