Open Access
Fig. 3
Download original image
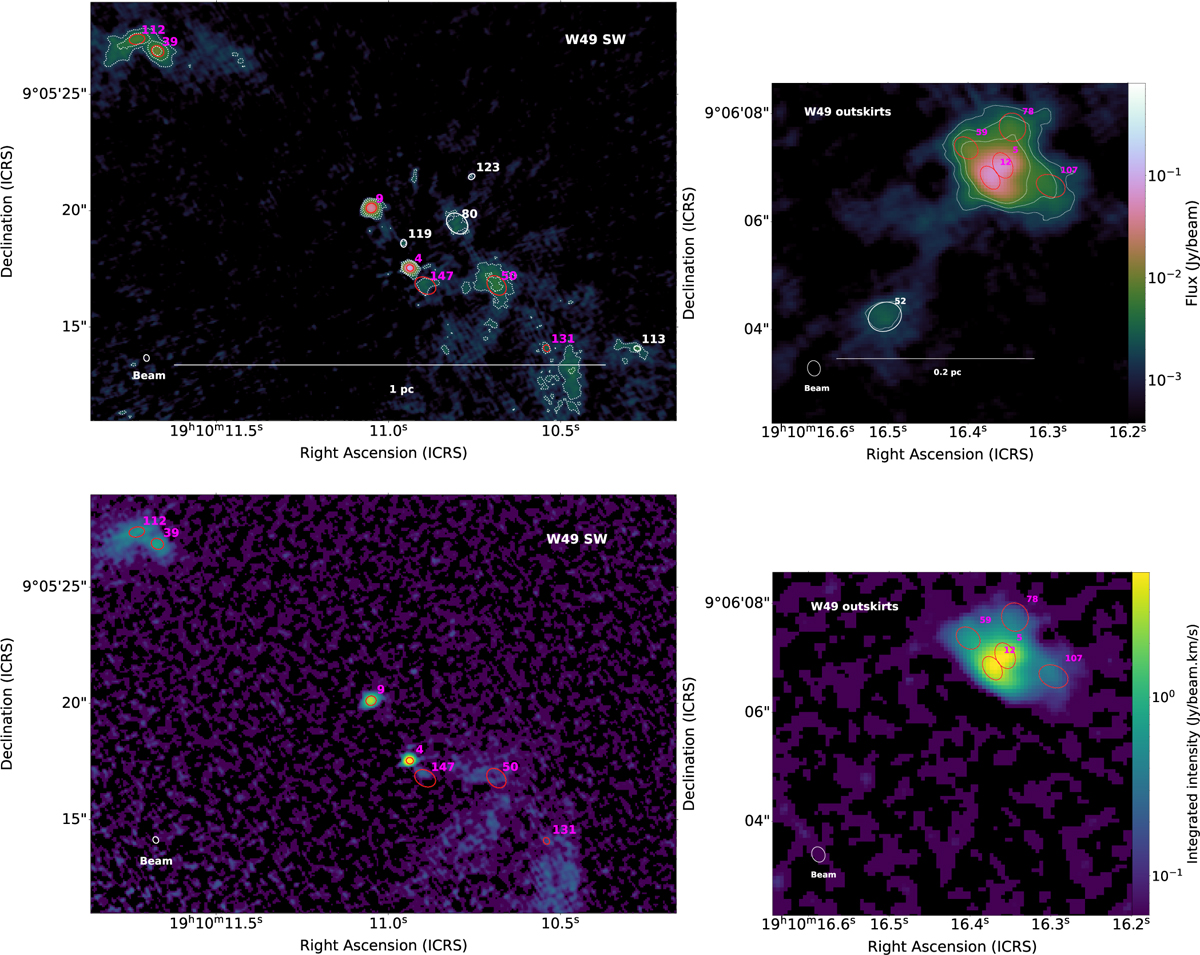
Maps of 1.3 millimeter continuum and recombination line toward W49 SW (left panels) and the eastern outskirts (right panels). Top panel: Band 6 continuum image. Contours are 5, 10, and 20 sigma. Bottom panel: moment 0 map of H30α line. The same conventions of Fig. 2 apply for the ellipses and lines.
Current usage metrics show cumulative count of Article Views (full-text article views including HTML views, PDF and ePub downloads, according to the available data) and Abstracts Views on Vision4Press platform.
Data correspond to usage on the plateform after 2015. The current usage metrics is available 48-96 hours after online publication and is updated daily on week days.
Initial download of the metrics may take a while.