Fig. 2
Download original image
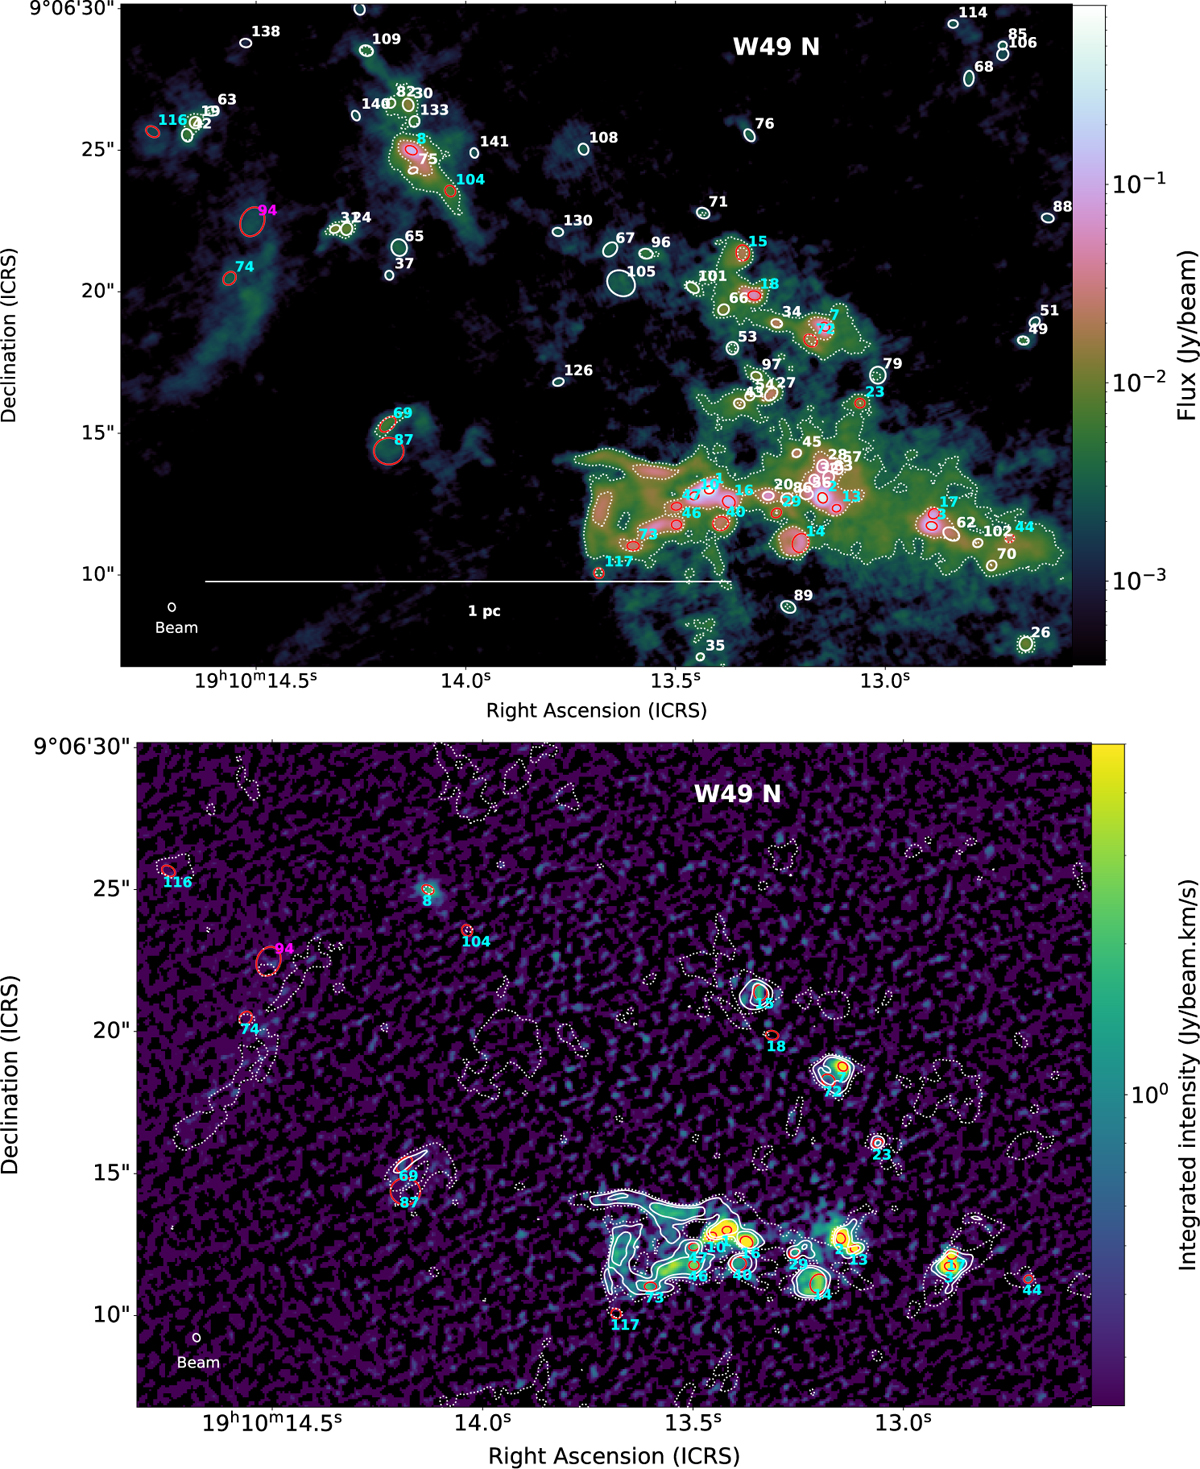
Maps of the 1.3 millimeter continuum and recombination line toward W49N at the center of W49A. Top panel: ALMA B6 continuum image, contours are 10 and 40 sigma. Bottom panel: moment 0 map of H30α (color) and VLA X band map (contours). Contours are 3 sigma (dotted lines), 15, and 40 sigma (solid lines). Dust cores are represented by their FWHM ellipses and numbered with the same colors as in Fig. 1. Cores detected in the X band and/or in H30α are shown in red. The top panel also shows the remainder of the core catalog in white. Beams are shown in the lower-left corner. A scale bar is shown in the top panel.
Current usage metrics show cumulative count of Article Views (full-text article views including HTML views, PDF and ePub downloads, according to the available data) and Abstracts Views on Vision4Press platform.
Data correspond to usage on the plateform after 2015. The current usage metrics is available 48-96 hours after online publication and is updated daily on week days.
Initial download of the metrics may take a while.