Fig. 1

Download original image
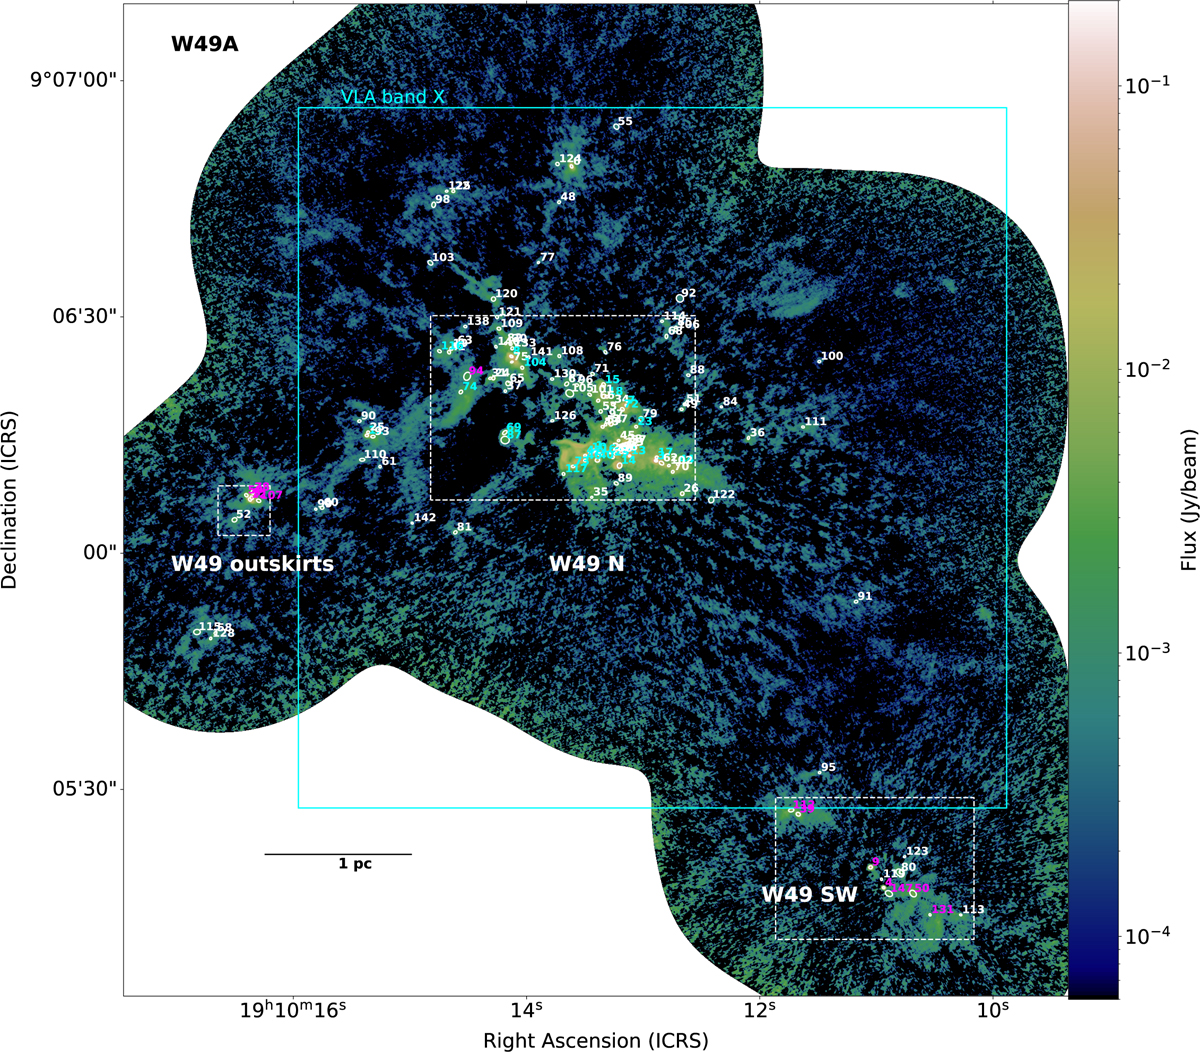
The W49A protocluster as imaged at 1.3 mm using ALMA. Dust cores are represented by their FWHM ellipses in white and numbered in cyan for cores also detected at 3.3 cm. In magenta numbers are cores detected only in H30α, and in white numbers are non-detections at both 3.3 cm and H30α. The field of view of the VLA X band image is represented with a solid cyan line. A scale bar is shown. Zoom-ins of the three main regions of interest (W49N, W49SW and W49 outskirts) delimited by white dashed lines are shown in Figs. 2 and 3.
Current usage metrics show cumulative count of Article Views (full-text article views including HTML views, PDF and ePub downloads, according to the available data) and Abstracts Views on Vision4Press platform.
Data correspond to usage on the plateform after 2015. The current usage metrics is available 48-96 hours after online publication and is updated daily on week days.
Initial download of the metrics may take a while.


