Fig. 9.
Download original image
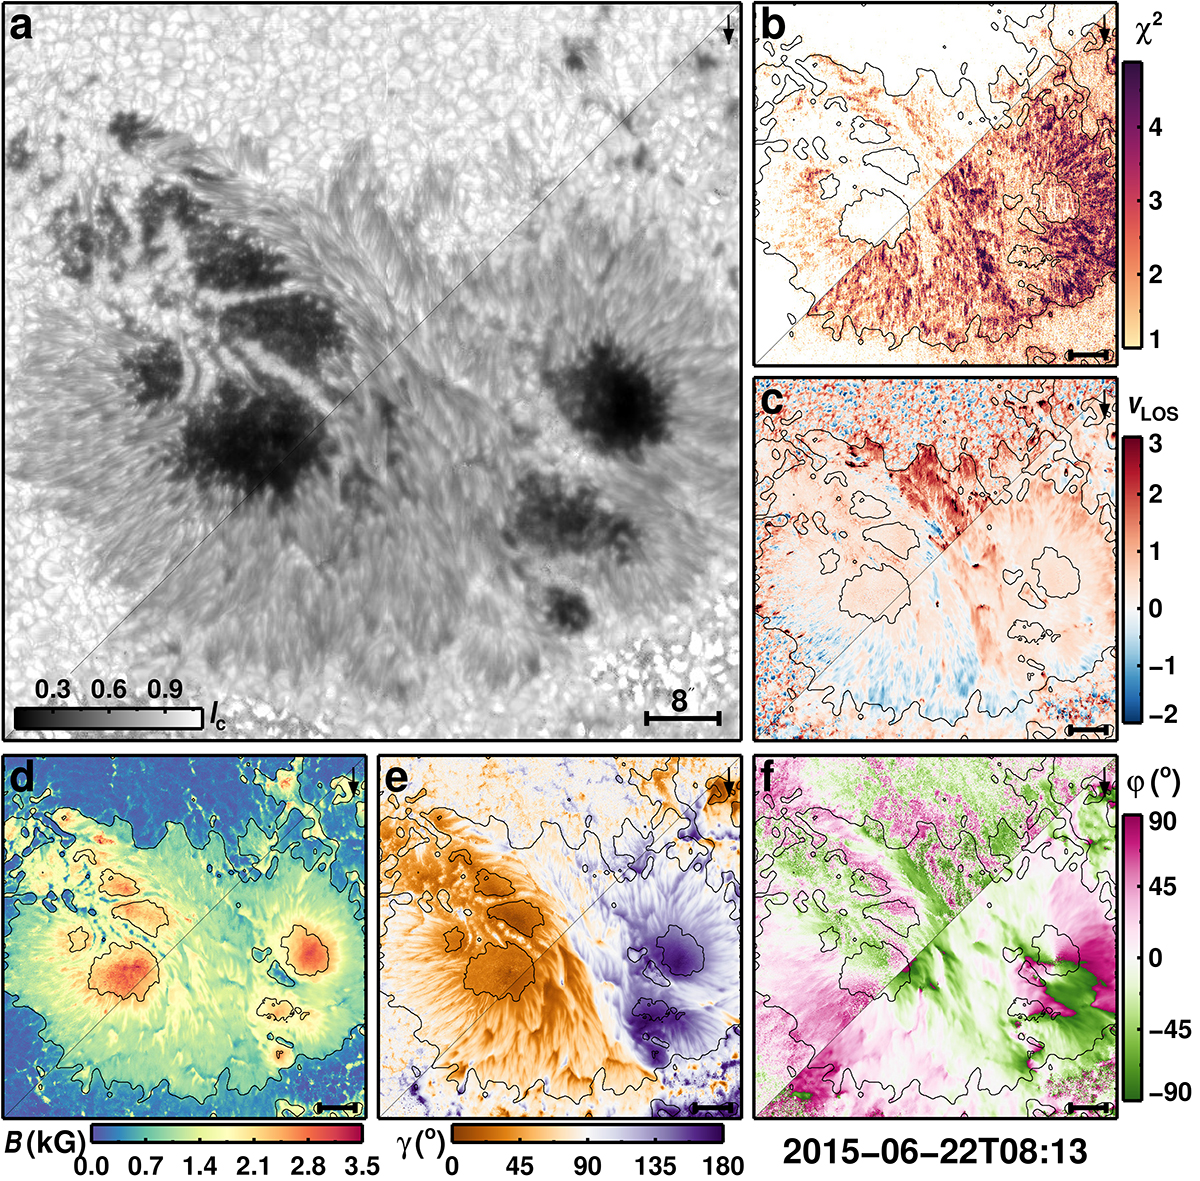
Atmospheric maps of AR 12371 obtained with the spatially coupled inversions at the middle node (log τ = −0.8; top-left half of each panel) and MERLIN (Level-2; bottom-right half). Panel a shows the best-fit continuum map. The atmospheric parameters retrieved by both inversion schemes are shown in the panels: (b) χ2 map, (c) line-of-sight velocity, (d) magnetic field strength, (e) magnetic field inclination relative to the line of sight, and (f) azimuth relative to the line of sight. Atmospheric maps at the middle node were used for the coupled inversions. Horizontal bars on the bottom-right mark 8″. This scan was observed in normal mode with a pixel size of 0![]() 16.
16.
Current usage metrics show cumulative count of Article Views (full-text article views including HTML views, PDF and ePub downloads, according to the available data) and Abstracts Views on Vision4Press platform.
Data correspond to usage on the plateform after 2015. The current usage metrics is available 48-96 hours after online publication and is updated daily on week days.
Initial download of the metrics may take a while.