Fig. 7.
Download original image
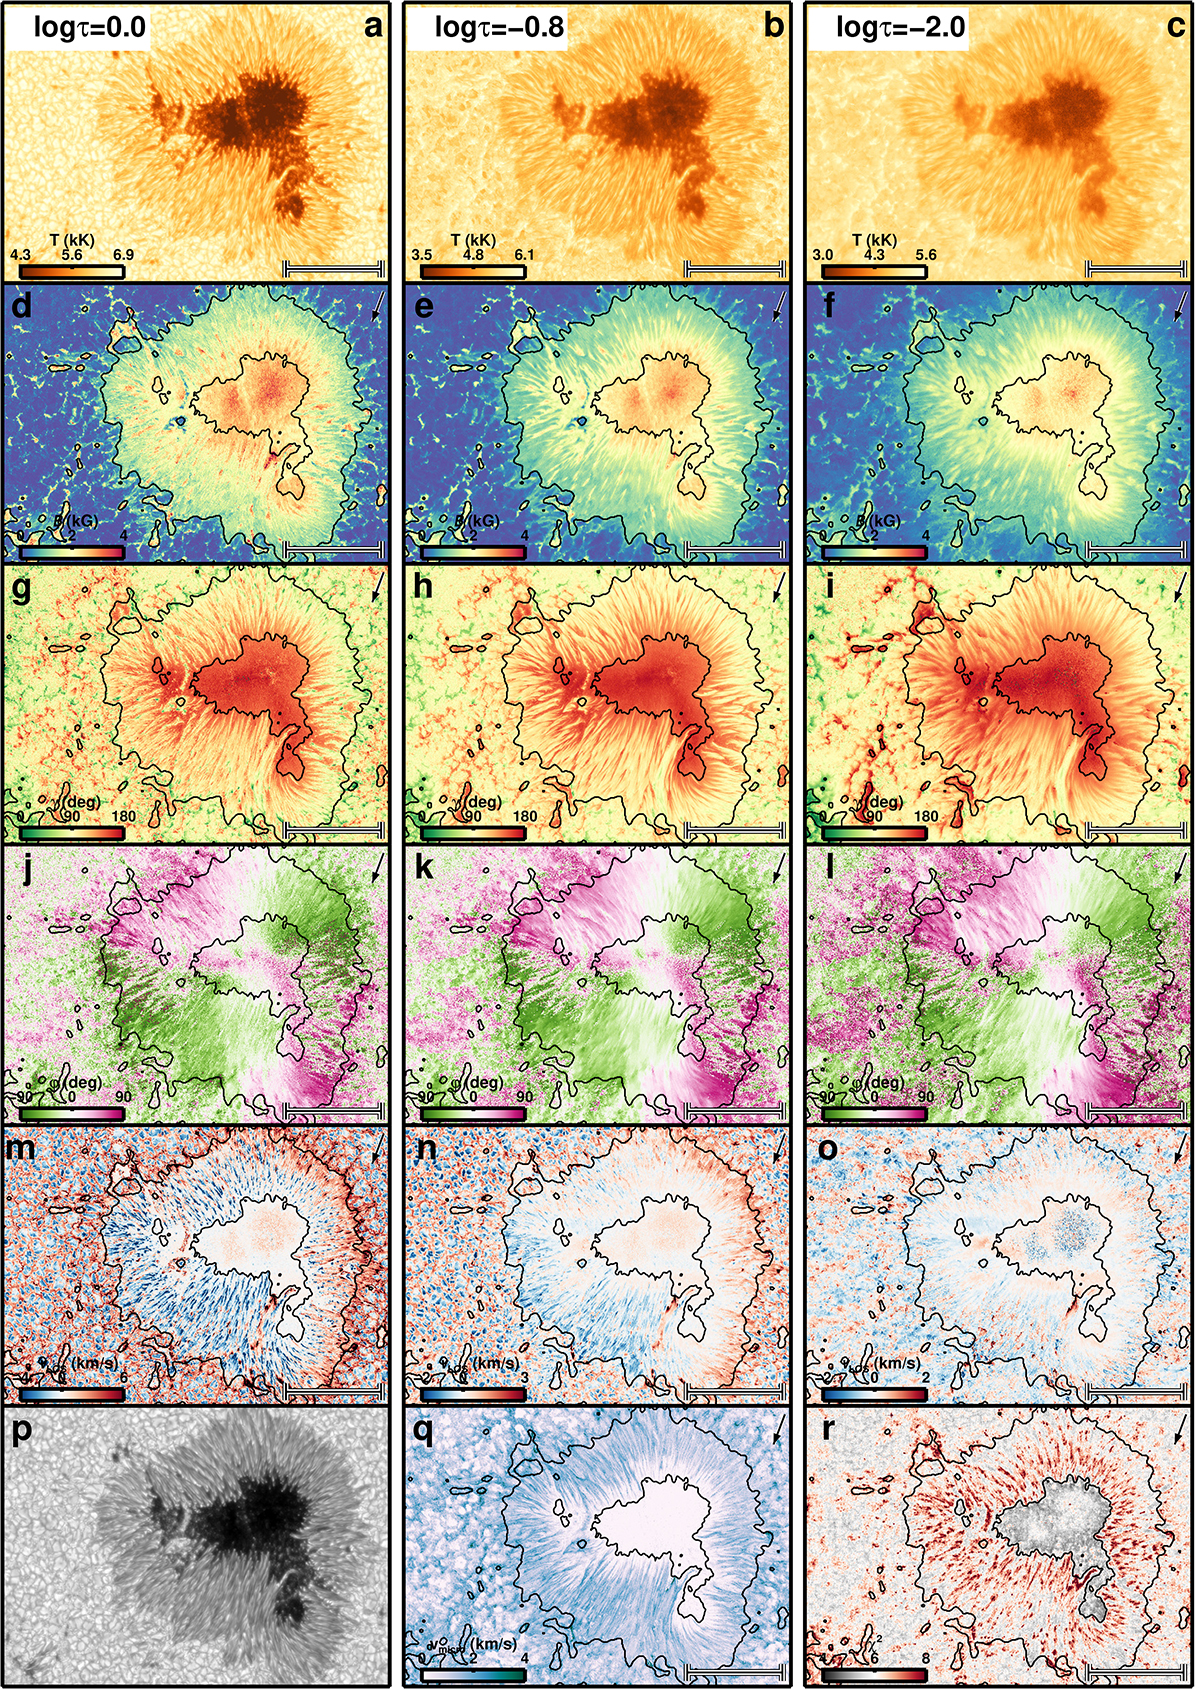
Depth-dependent atmospheric conditions retrieved by the coupled inversions of AR 10953 (2007 May 1). The first five rows show, from top to bottom, maps of the temperature, magnetic field strength, inclination, azimuth, and line-of-sight velocity. The columns show, from left to right, these quantities retrieved at log τ = 0, −0.8, and −2.0, i.e., at the bottom, middle, and top nodes. In the bottom row, panels p–r display the best-fit continuum, micro-turbulence, and ![]() maps. This scan was observed in normal mode with a pixel size of 0
maps. This scan was observed in normal mode with a pixel size of 0![]() 16. The FOV is composed of 8 × 10 tiles.
16. The FOV is composed of 8 × 10 tiles.
Current usage metrics show cumulative count of Article Views (full-text article views including HTML views, PDF and ePub downloads, according to the available data) and Abstracts Views on Vision4Press platform.
Data correspond to usage on the plateform after 2015. The current usage metrics is available 48-96 hours after online publication and is updated daily on week days.
Initial download of the metrics may take a while.