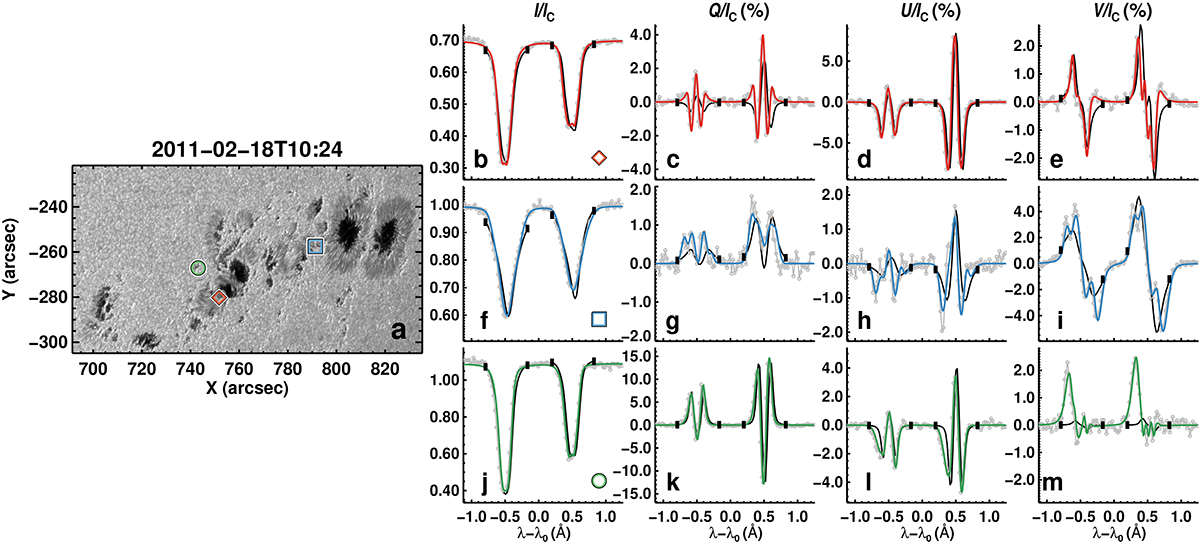
Fig. 4.
Download original image
Fits obtained by the coupled inversions to the observed Stokes profiles. Panel a shows the continuum image of AR 11158 when it was located at μ ≈ 0.6. Columns 2 to 5 show the observed Stokes profiles (dotted gray lines), the retrieved fits obtained by the coupled inversions (colored lines), and the ME inversion by MERLIN (black lines). Vertical black bars mark the spectral windows that MERLIN uses for the Level-2 inversions. The locations of the plotted profiles are marked on the continuum images with colored symbols. λ0 = 6302 Å.
Current usage metrics show cumulative count of Article Views (full-text article views including HTML views, PDF and ePub downloads, according to the available data) and Abstracts Views on Vision4Press platform.
Data correspond to usage on the plateform after 2015. The current usage metrics is available 48-96 hours after online publication and is updated daily on week days.
Initial download of the metrics may take a while.