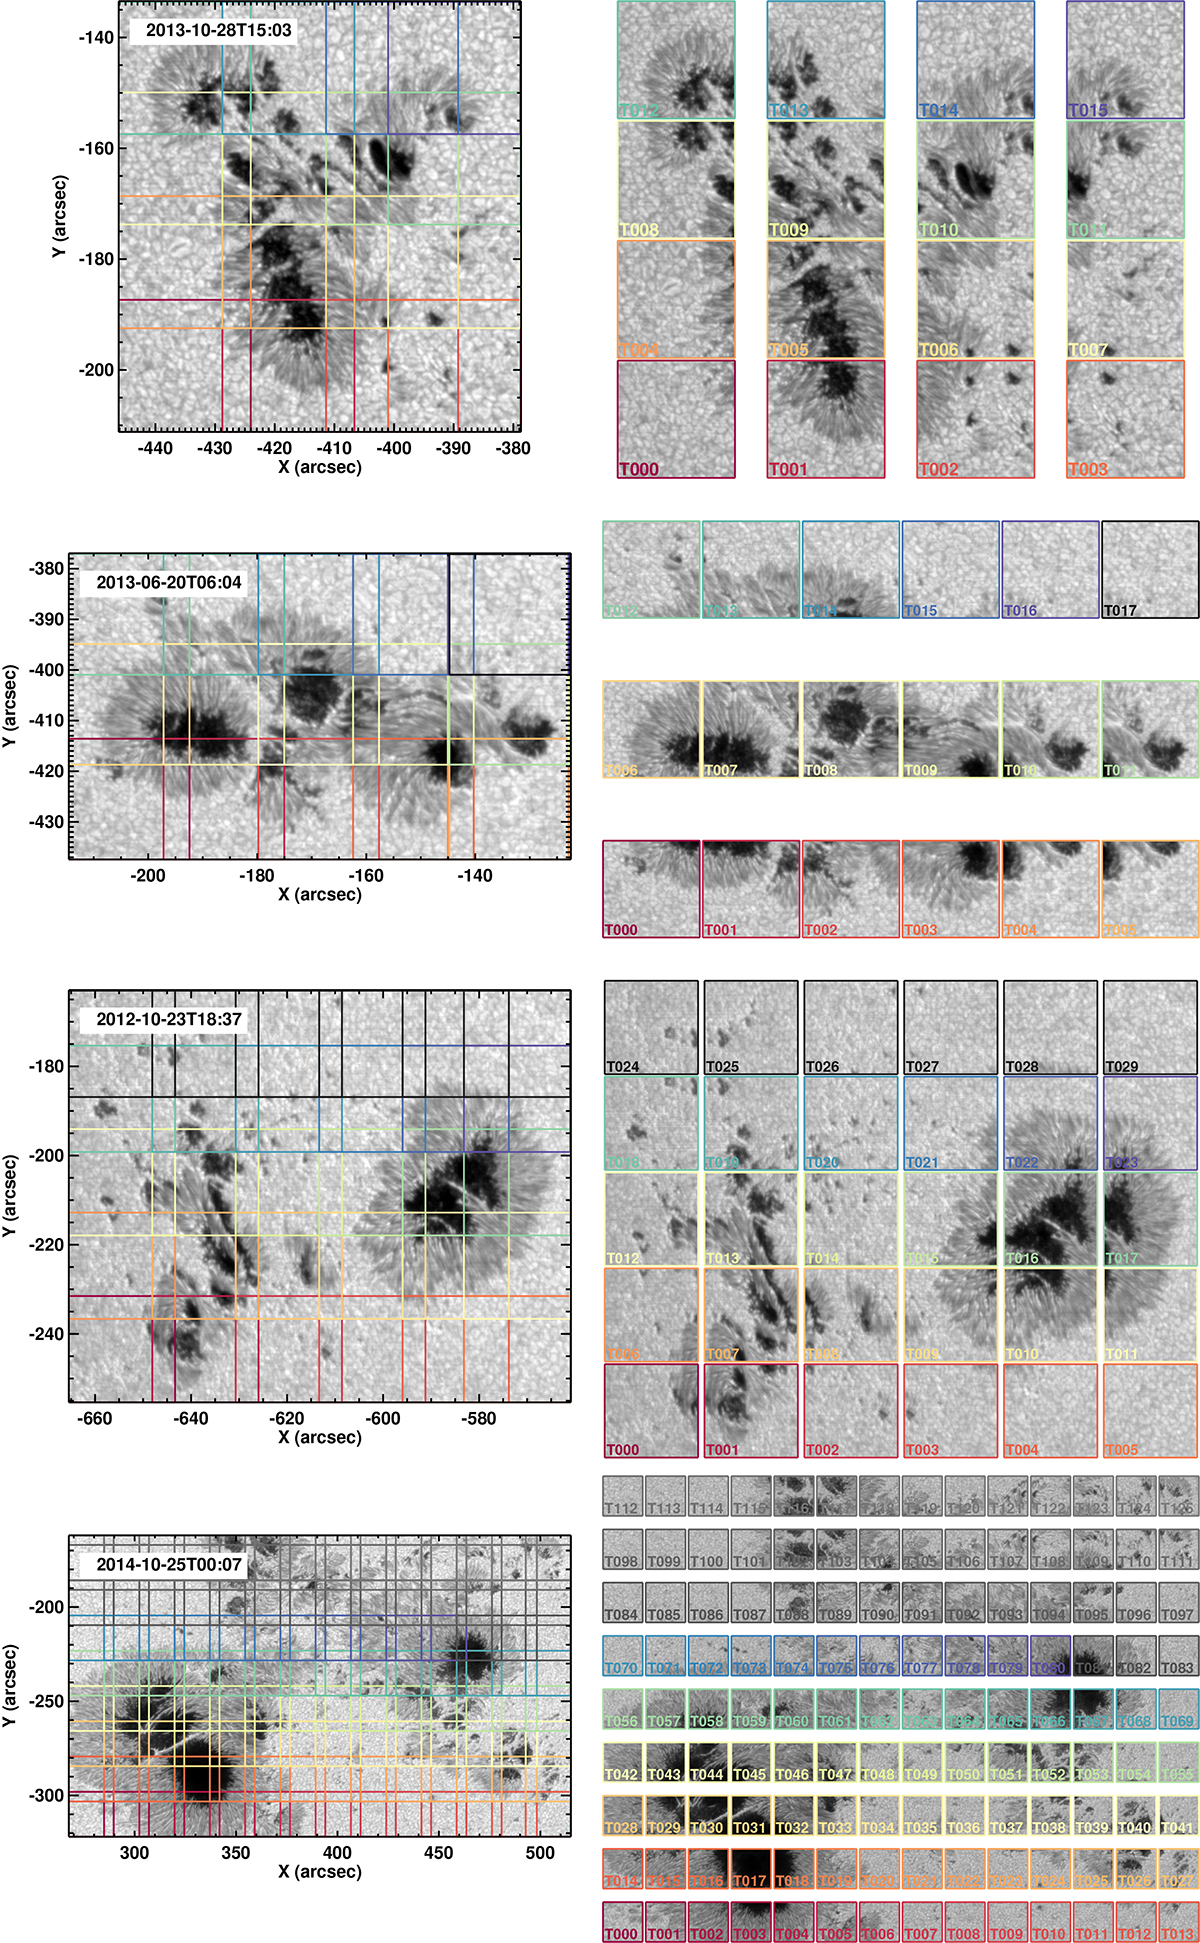
Fig. 3.
Download original image
Illustration of the division of the FOV into tiles for the coupled inversions. From top to bottom: continuum maps of AR 11882, AR 11775, AR 11560, and AR 12192 as observed by Hinode/SOT-SP. Colored lines mark the location of the tiles into which the FOV is divided (left). Notice that the tiles are designed to overlap. The right column shows the individual continuum maps of each individual tile.
Current usage metrics show cumulative count of Article Views (full-text article views including HTML views, PDF and ePub downloads, according to the available data) and Abstracts Views on Vision4Press platform.
Data correspond to usage on the plateform after 2015. The current usage metrics is available 48-96 hours after online publication and is updated daily on week days.
Initial download of the metrics may take a while.