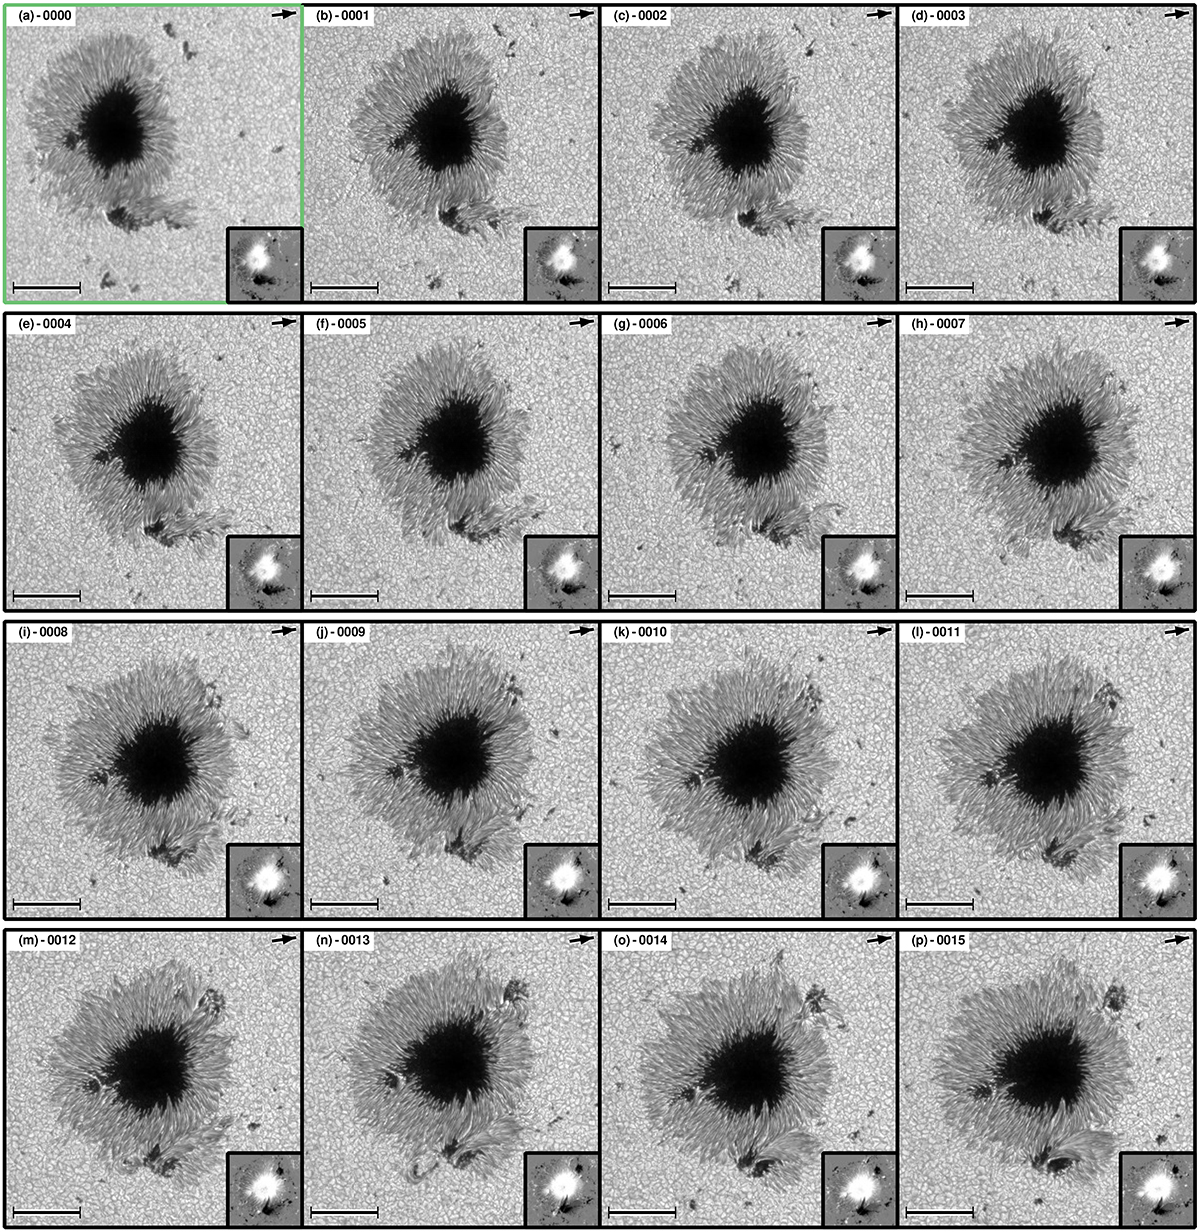
Fig. D.1.

Download original image
Best-fit continuum maps and magnetograms of the sample of sunspots in the MODEST catalog. Numbers on the upper-left part of each panel are the INV_ID of each inversion. INV_IDs can be found on the second column of Table D.1. Bars on the bottom-left corner have a length of 20″, and arrows on the top-right corner point toward disk center. Insets on the lower-right show the magnetogram (Bcos(γLOS)) in the line-of-sight reference frame clipped at 1.5 kG obtained at the middle node. Axes colors display whether the scan was taken in fast (black) or normal mode (green).
Current usage metrics show cumulative count of Article Views (full-text article views including HTML views, PDF and ePub downloads, according to the available data) and Abstracts Views on Vision4Press platform.
Data correspond to usage on the plateform after 2015. The current usage metrics is available 48-96 hours after online publication and is updated daily on week days.
Initial download of the metrics may take a while.


