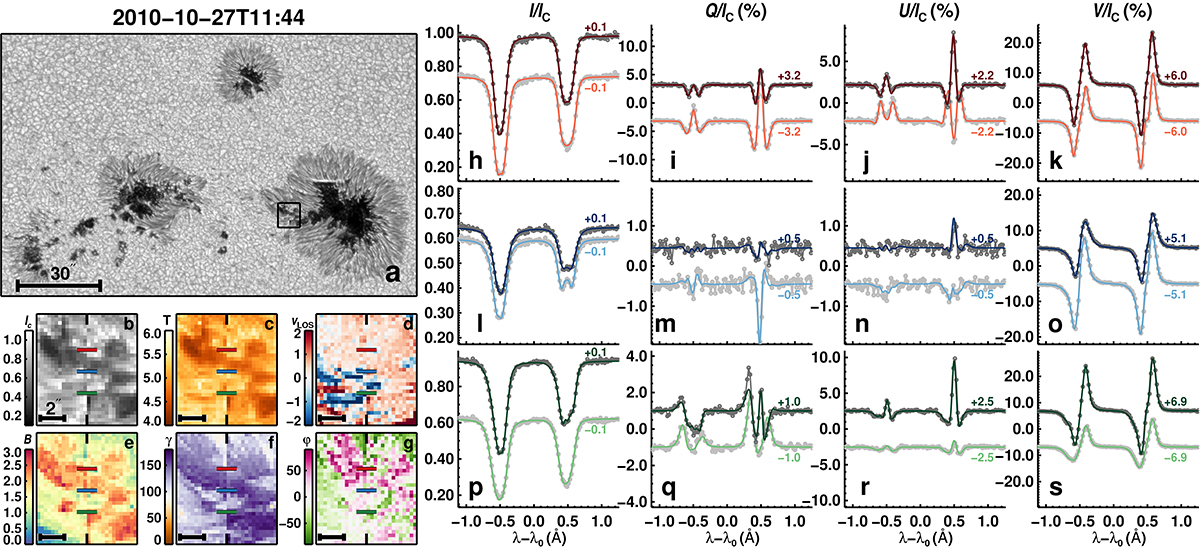
Fig. C.1.

Download original image
Fits obtained by the coupled inversions to the observed Stokes profiles for medium-quality pixels. Panel (a) shows the continuum image of AR 11117 when it was located at μ ≈ 0.9. Maps in panels (b) to (g) display the continuum intensity (b), temperature (c), vLOS (d), magnetic field strength (e), inclination (f), and azimuth (g). These maps are from the region outlined by the black rectangle in panel (a). Columns 2 to 5 show the observed Stokes profiles (dotted gray lines) and the best fits obtained by the coupled inversions (colored lines). A vertical shift was added to the Stokes profiles for better representation. The shift values are displayed on the right side of each profile. Each row shows two Stokes vectors coming from neighboring pixels lying immediately to the left (darker lines) and to the right (lighter lines) of a sharp discontinuity in the data (indicated by black vertical tick marks in (b)–(g)). Colored horizontal lines in panels (b) to (g) mark the locations of the profiles. λ0 = 6302 Å.
Current usage metrics show cumulative count of Article Views (full-text article views including HTML views, PDF and ePub downloads, according to the available data) and Abstracts Views on Vision4Press platform.
Data correspond to usage on the plateform after 2015. The current usage metrics is available 48-96 hours after online publication and is updated daily on week days.
Initial download of the metrics may take a while.


