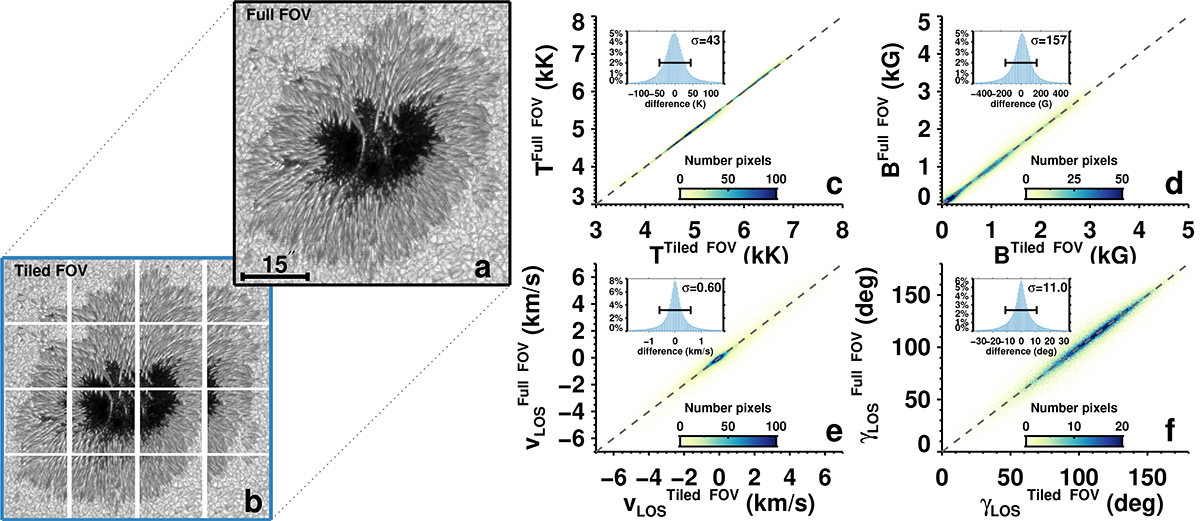
Fig. B.1.
Download original image
Effects of tiling the FOV. Panel (a) shows the full un-tiled continuum image of AR 11748 when it was located close to disk center. Panel (b) shows the FOV broken up into overlapping tiles. The edges of each tile are marked by the white lines FOV. Scatter plots of atmospheric parameters obtained with or without the tiling are displayed in Panels (c)-(d). Data points from all three optical depth nodes are plotted in each panel. The individual panels display the temperature (c), magnetic field strength (d), line-of-sight velocity (e), and line-of-sight inclination of the magnetic field (f). The x-axis displays the inversions performed with the tiled FOV, while the y-axis shows the inversions for the whole FOV inverted in one go for the three-node height. The insets inside panels (c)-(f) show the histograms of differences between the two inversions, where the black bars indicate 1σ.
Current usage metrics show cumulative count of Article Views (full-text article views including HTML views, PDF and ePub downloads, according to the available data) and Abstracts Views on Vision4Press platform.
Data correspond to usage on the plateform after 2015. The current usage metrics is available 48-96 hours after online publication and is updated daily on week days.
Initial download of the metrics may take a while.