Fig. 11.
Download original image
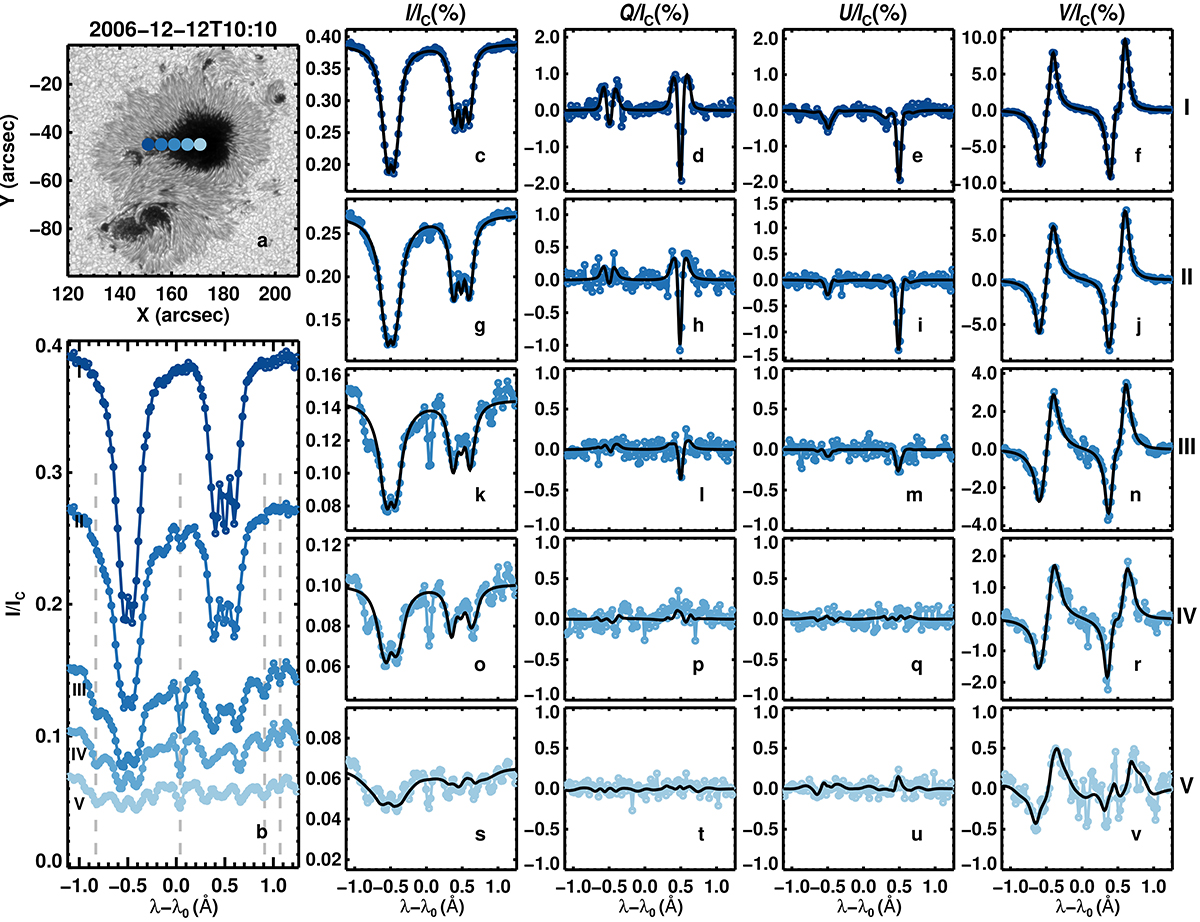
Hinode/SOT-SP observations of AR 10930 observed almost at disk center (μ = 0.99). Panel a shows the continuum image. Blue circles overplotted on the continuum image mark the locations inside the umbra of the spectra plotted in the remaining panels, color-coded according to the region they were observed in. Lighter blue represents darker and cooler umbral regions, where blends with molecular lines appear. Panel b shows the five normalized Stokes I(λ) profiles. The spectra are displayed on the same intensity scale for comparison (i.e., all spectra are normalized to the average quiet-Sun continuum intensity). Dashed-gray vertical lines mark four prominent molecular blends identified at 6301.2 Å, 6302.0 Å, 6302.9 Å, and 6303.1 Å. Columns 2 to 5 (panels c-v) show the full observed Stokes vectors emerging at the same spatial pixels and the best fits found by the coupled inversions (black lines). λ0 = 6302 Å.
Current usage metrics show cumulative count of Article Views (full-text article views including HTML views, PDF and ePub downloads, according to the available data) and Abstracts Views on Vision4Press platform.
Data correspond to usage on the plateform after 2015. The current usage metrics is available 48-96 hours after online publication and is updated daily on week days.
Initial download of the metrics may take a while.