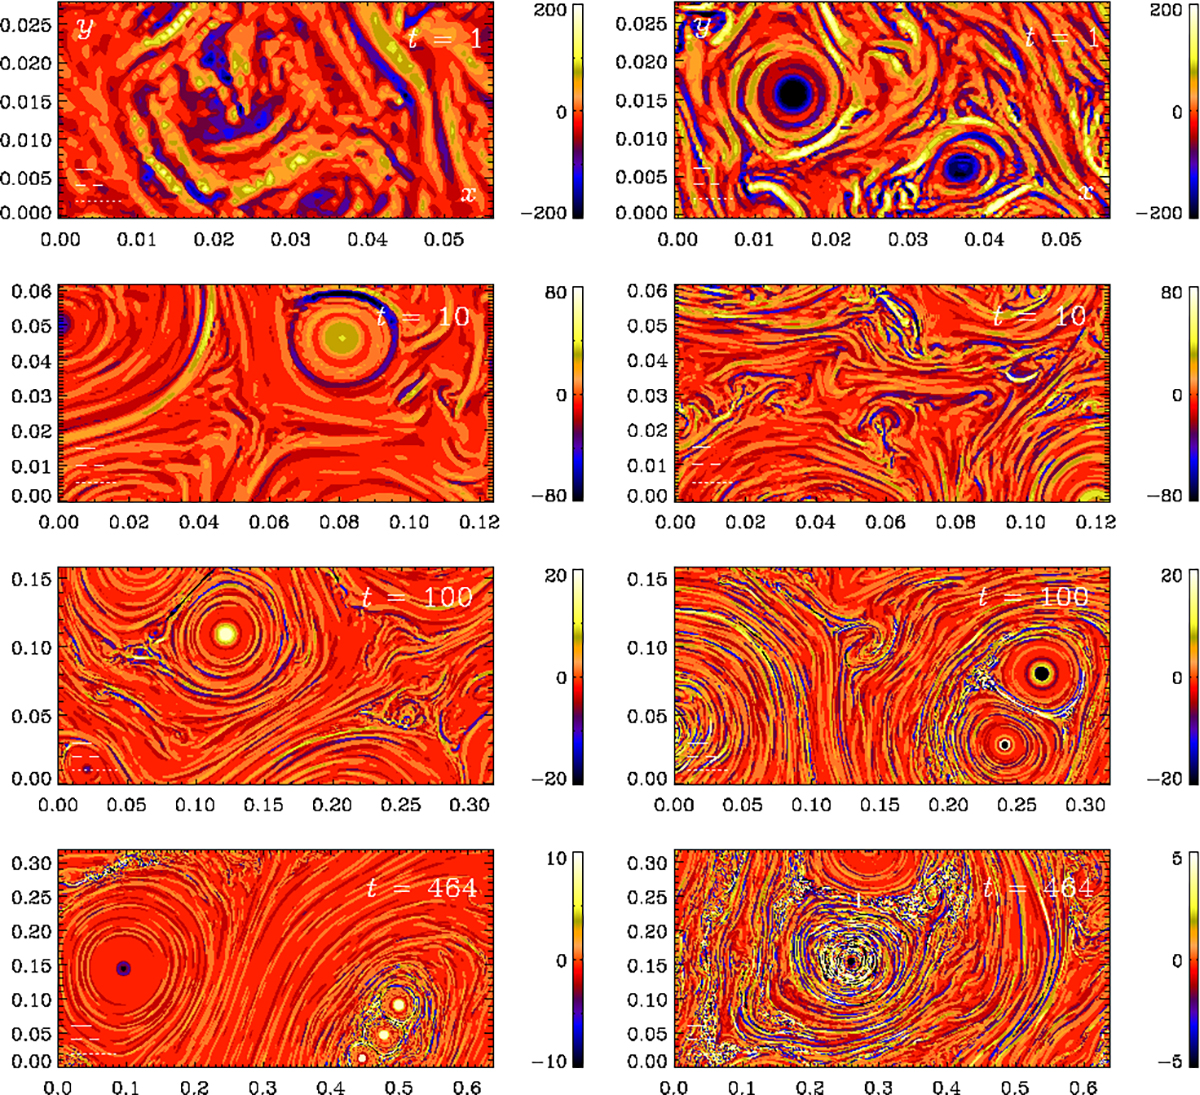
Fig. B.1.
Download original image
Comparisons of visualizations of Jz(x, y) for Runs 2m5 and 2m6 with PrM = 10 and 81922 (left) and 163842 (right) mesh points at times t = 1, 10, 100, and 464. In each panel the lengths of the dotted, dashed, and solid lines denote the values of ξM, 5 Lc, and 500 δc. The bottom right panel shows the same current sheet that was presented in Fig. 14 as a blow-up. The thick white line in that panel at (x, y) = (0.27, 0.25) marks the location of the cross section shown in Fig. 15.
Current usage metrics show cumulative count of Article Views (full-text article views including HTML views, PDF and ePub downloads, according to the available data) and Abstracts Views on Vision4Press platform.
Data correspond to usage on the plateform after 2015. The current usage metrics is available 48-96 hours after online publication and is updated daily on week days.
Initial download of the metrics may take a while.