Open Access
Fig. 3
Download original image
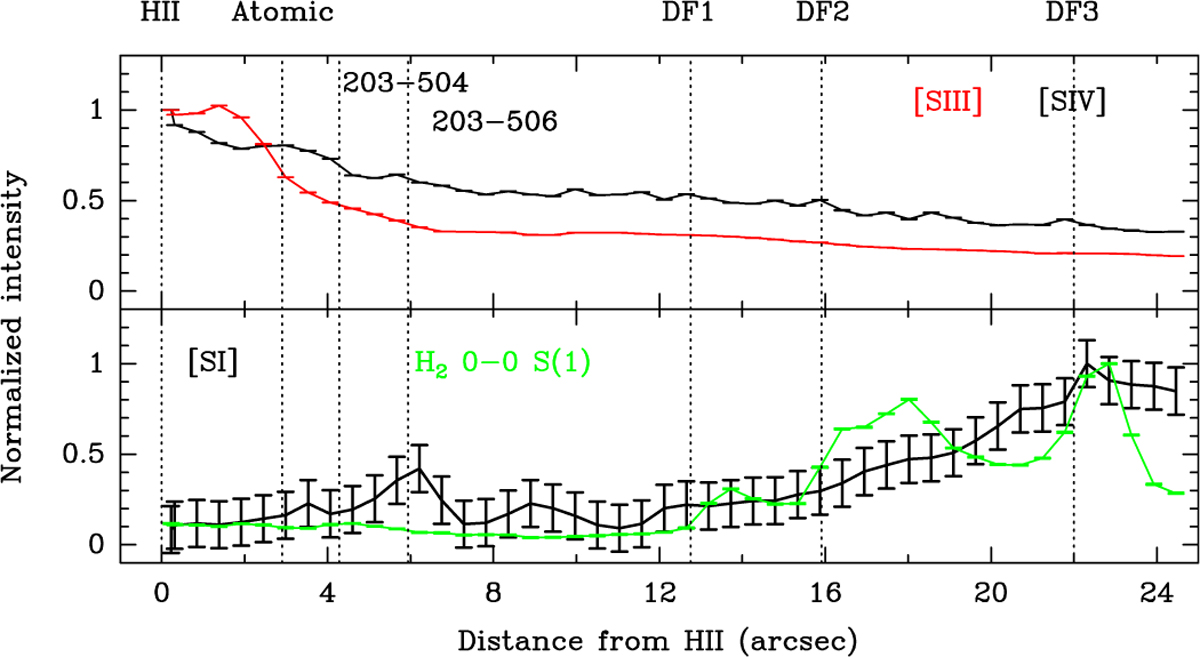
Cuts along the straight line starting at HII and crossing all the DFs drawn in the H2 S(1) panel of Fig. 2. In all cases, the intensity has been normalized to 1. Dashed lines indicate the positions of HII, Atomic, DF1, DF2, DF3, and the protostellar objects d203-504 and d203-506.
Current usage metrics show cumulative count of Article Views (full-text article views including HTML views, PDF and ePub downloads, according to the available data) and Abstracts Views on Vision4Press platform.
Data correspond to usage on the plateform after 2015. The current usage metrics is available 48-96 hours after online publication and is updated daily on week days.
Initial download of the metrics may take a while.