Fig. 2
Download original image
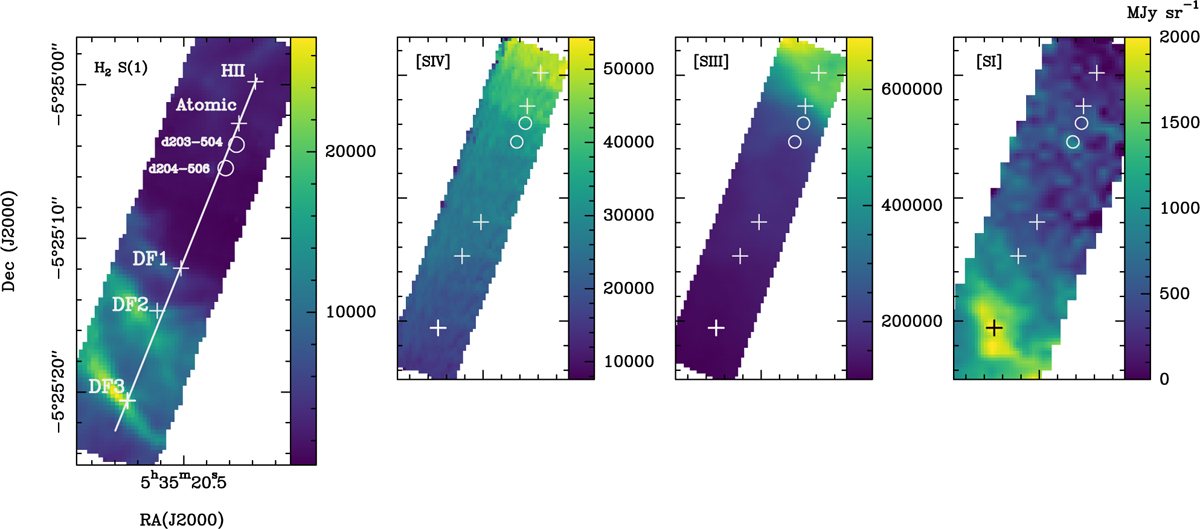
Peak intensity maps of the lines indicated in the top-left corner of each panel. All the maps have been re-grided to a pixel of ~0.3″. Crosses indicate the positions of HII, Atomic, DF1, DF2, and DF3, as listed in Table A.1. Circles indicate the positions of the protoplanetary disks d203-504 and d203-506 (Bally et al. 2000). The straight line indicates the cut shown in Fig. 3. The rms in each map is: 80 MJy sr−1 (H2 S(1)), 50 MJy sr−1 ([SIV]), 80 MJy sr−1 ( [S III] ), and 273 MJy sr−1 ([S I]).
Current usage metrics show cumulative count of Article Views (full-text article views including HTML views, PDF and ePub downloads, according to the available data) and Abstracts Views on Vision4Press platform.
Data correspond to usage on the plateform after 2015. The current usage metrics is available 48-96 hours after online publication and is updated daily on week days.
Initial download of the metrics may take a while.