Fig. 1
Download original image
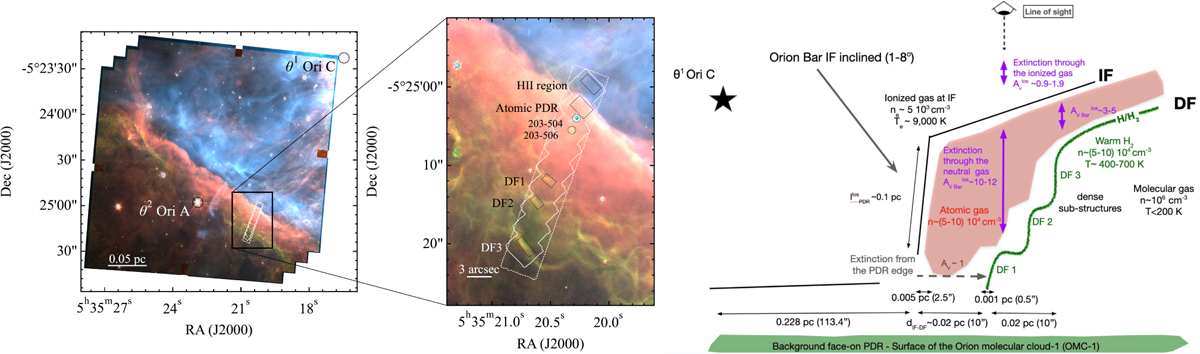
Overview of the NIRSpec and MIRI MRS mosaics observed in PDRs4All and scheme of the geometry of the Orion Bar. Left panel: composite NIRCam image encoded as follows: F335M (AIB emission) in red, F470N-F480M (H2 emission) in green, and F187N (Paschen α emission) in blue (Habart et al. 2024; Peeters et al. 2024). The footprints of the NIRSpec and MIRI MRS mosaics are shown as solid and dashed lines, respectively. The positions of DF1, DF2, and DF3, as defined by Habart et al. (2024), together with those of the protostars d203-504 and d203-506 are indicated. This figure has been taken from Chown et al. (2024). Right panel: sketch of the Orion Bar adapted from Habart et al. (2024) and Peeters et al. (2024).
Current usage metrics show cumulative count of Article Views (full-text article views including HTML views, PDF and ePub downloads, according to the available data) and Abstracts Views on Vision4Press platform.
Data correspond to usage on the plateform after 2015. The current usage metrics is available 48-96 hours after online publication and is updated daily on week days.
Initial download of the metrics may take a while.