Fig. 7
Download original image
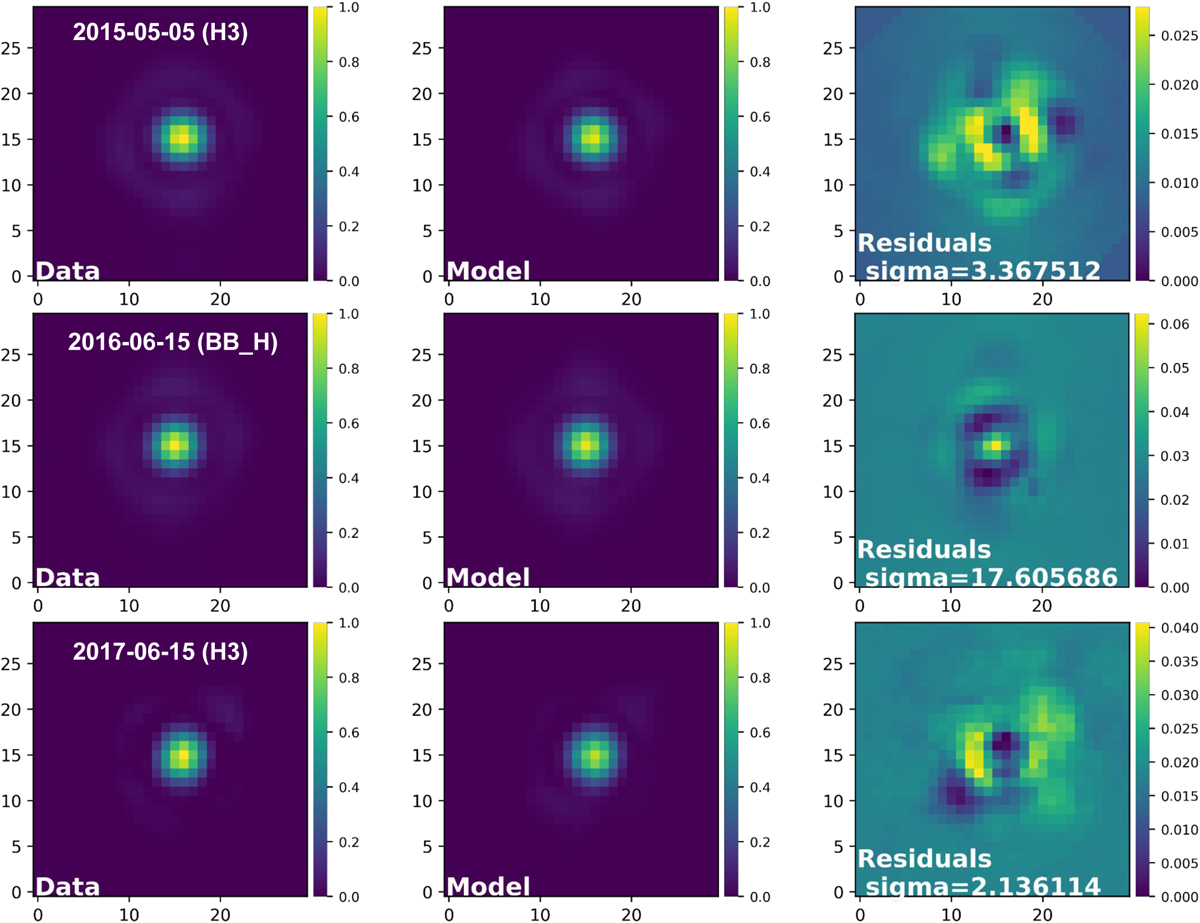
Analysis of the close surroundings of η Tel B to look for satellites and/or CPDs. In each row, the first panel shows the ADI image zoomed on η Tel B, the second panel shows the model, and the last one the residuals from the subtraction of the two. The three IRDIS epochs are shown. The residuals are expressed in counts. All the panels were normalized to the peak of the central PSF.
Current usage metrics show cumulative count of Article Views (full-text article views including HTML views, PDF and ePub downloads, according to the available data) and Abstracts Views on Vision4Press platform.
Data correspond to usage on the plateform after 2015. The current usage metrics is available 48-96 hours after online publication and is updated daily on week days.
Initial download of the metrics may take a while.