Open Access
Fig. 2.
Download original image
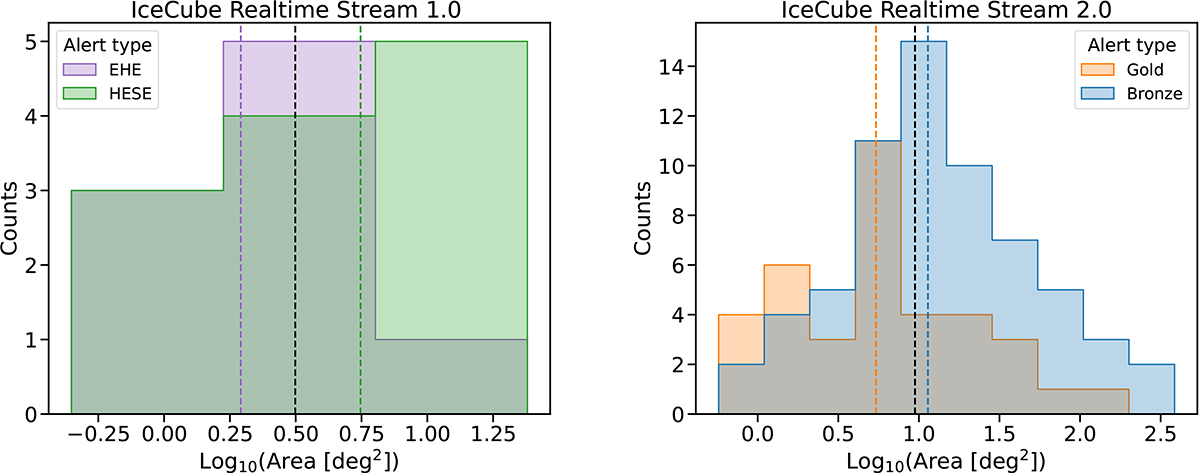
Distribution of 90% error region extensions for the IceCube Realtime Stream 1.0 (left) and 2.0 (right) colour-coded by alert type. The dashed colored lines in both plots show the median values for the each alert class, while the black dashed lines show the medians of the full samples of each alert stream.
Current usage metrics show cumulative count of Article Views (full-text article views including HTML views, PDF and ePub downloads, according to the available data) and Abstracts Views on Vision4Press platform.
Data correspond to usage on the plateform after 2015. The current usage metrics is available 48-96 hours after online publication and is updated daily on week days.
Initial download of the metrics may take a while.