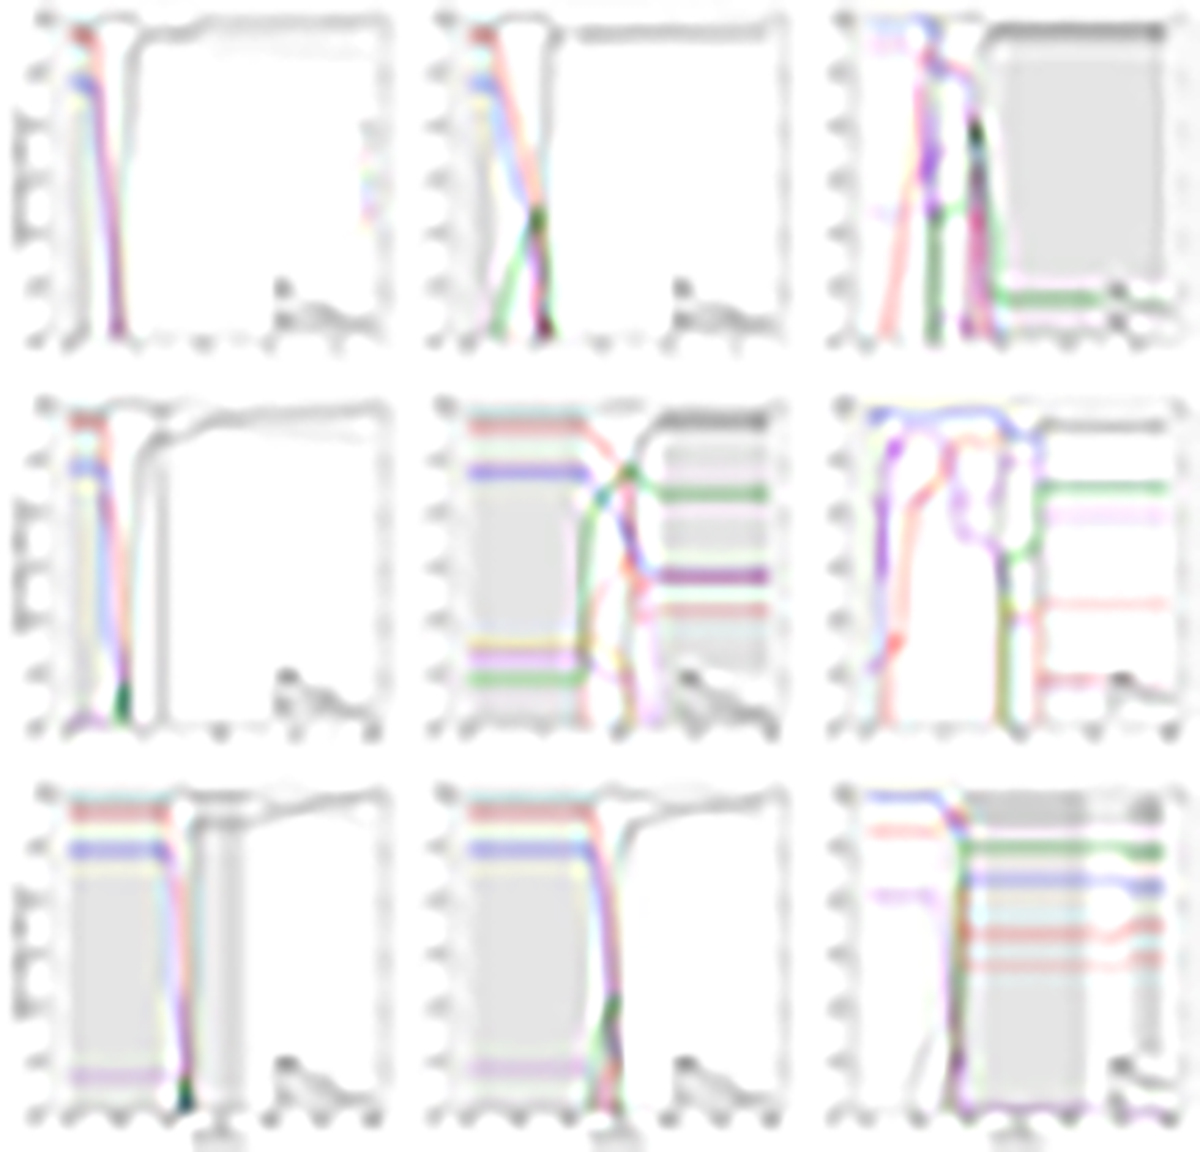
Fig. 6.
Download original image
Chemical structure as a function of the Lagrangian mass coordinate in the interior of the Pop III grids for 9 M⊙ ≤ Mini ≤ 60 M⊙. The figures are at halfway through the core He-burning phase (Yc = 0.5) and at the last model that has been computed in different evolutionary stages. HeC is between the core He- and C-burning phase, CNe is the stage between the core C- and the Ne-burning phase, and O is during the core O-burning phase. The first column of the plots corresponds to the moderately rotating models with 40% of the critical rotation, and the middle and last columns correspond to the rapidly rotating models with 70% of the critical rotation. Each row refers to a different initial mass: the first row corresponds to 9 M⊙, the second to 20 M⊙, and the third to 60 M⊙. Each coloured curve represents a different element, as is noted in the upper left plot. The light brown zones are the convective areas of each model. The moderately rotating models have been taken from Murphy et al. (2021a). The solid curves correspond to the most common isotope of an element, and the dashed curves to the second most common isotope.
Current usage metrics show cumulative count of Article Views (full-text article views including HTML views, PDF and ePub downloads, according to the available data) and Abstracts Views on Vision4Press platform.
Data correspond to usage on the plateform after 2015. The current usage metrics is available 48-96 hours after online publication and is updated daily on week days.
Initial download of the metrics may take a while.