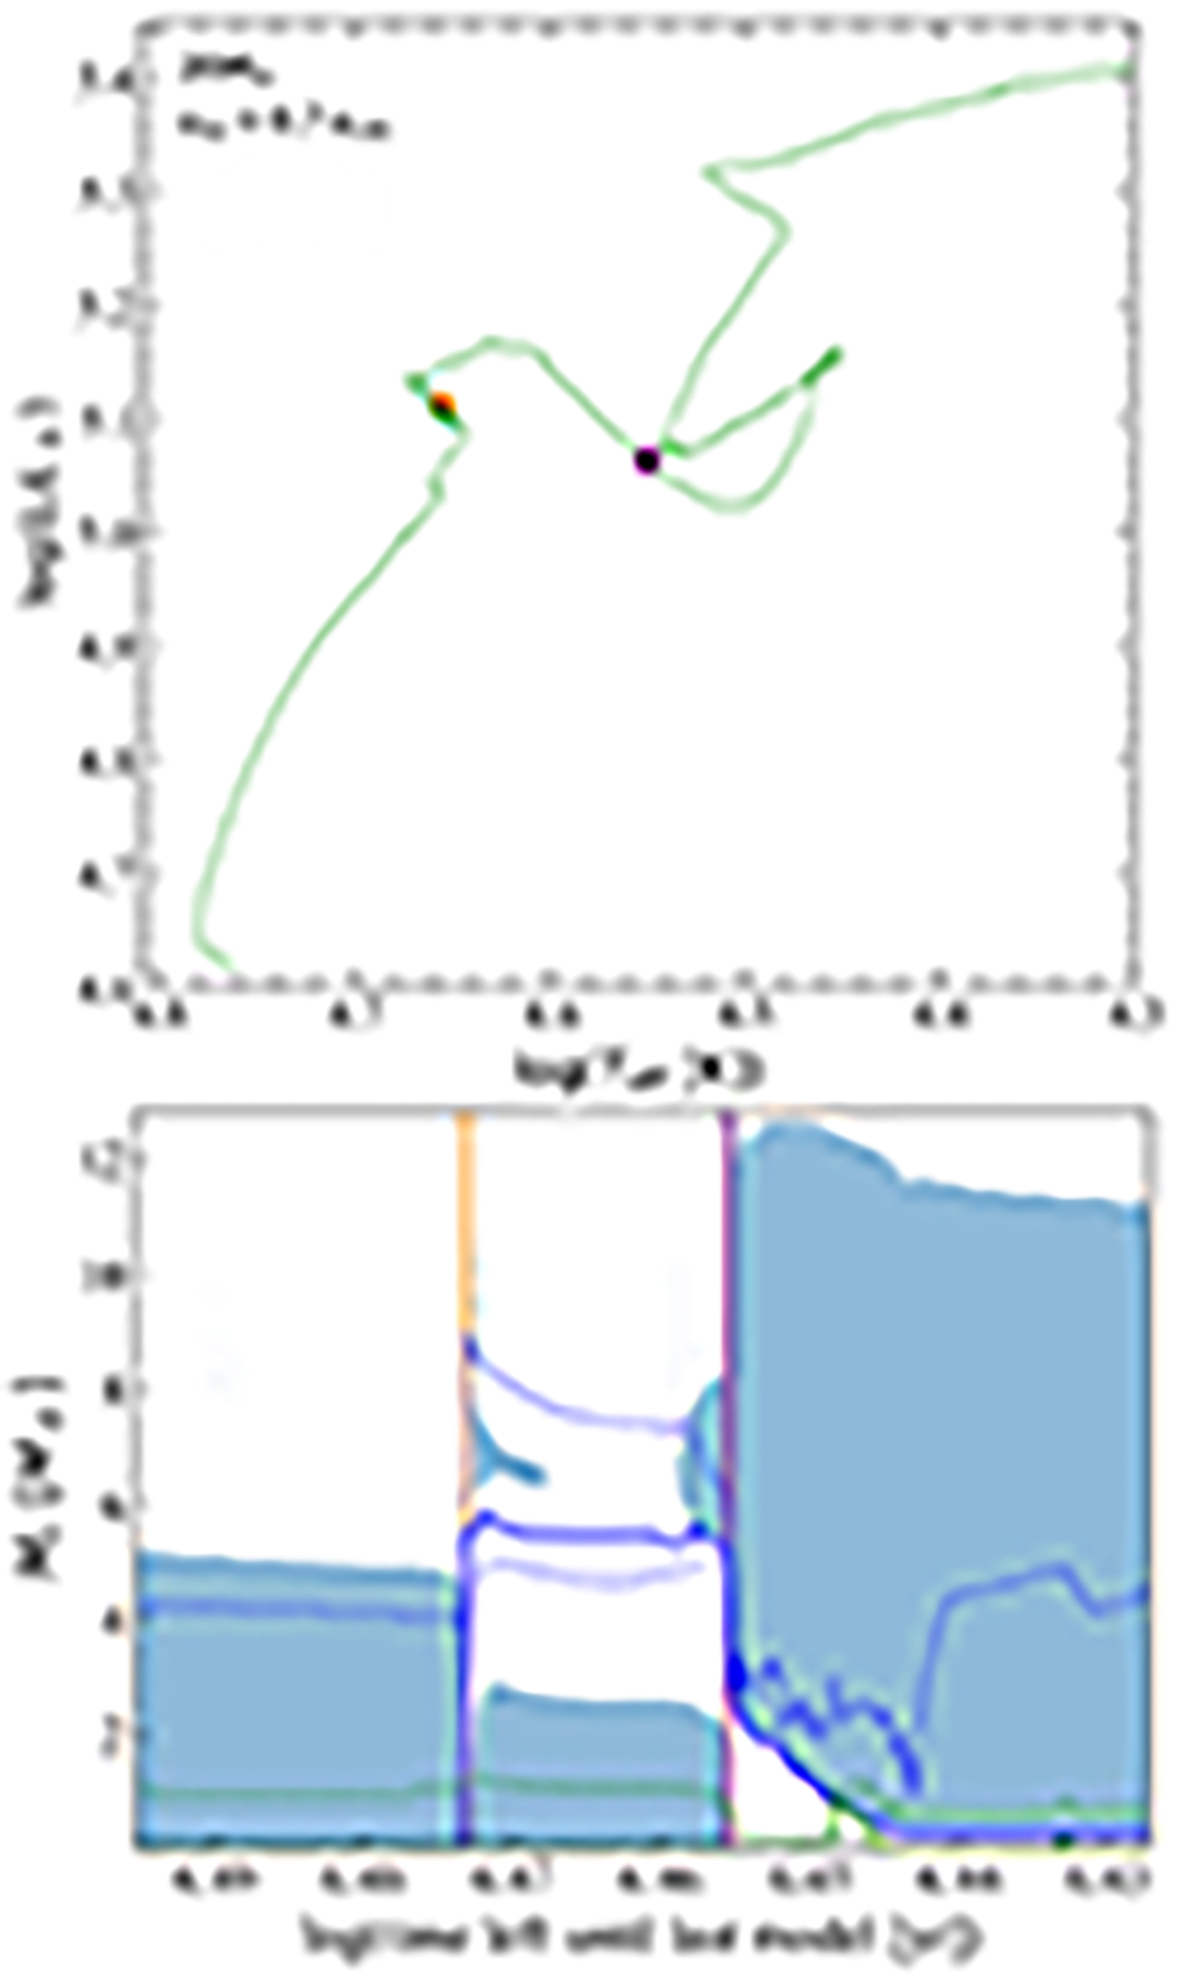
Fig. 5.
Download original image
Evolutionary track for the 20 M⊙ rapidly rotating model (upper panel) and Kippenhahn diagram (lower panel). The orange and purple points overplotted on the evolutionary track in the upper panel have an internal structure shown in the lower panel at the two times indicated by the vertical orange and purple lines, respectively. The blue-shaded zones are the convective areas, while the white zones are the radiative ones. The blue and green curves show the mass coordinates where hydrogen and helium are burning, respectively. Furthermore, the solid curves correspond to the peak of the energy generation rate and the dashed ones to 10% of the peak energy generation rate for each burning phase.
Current usage metrics show cumulative count of Article Views (full-text article views including HTML views, PDF and ePub downloads, according to the available data) and Abstracts Views on Vision4Press platform.
Data correspond to usage on the plateform after 2015. The current usage metrics is available 48-96 hours after online publication and is updated daily on week days.
Initial download of the metrics may take a while.