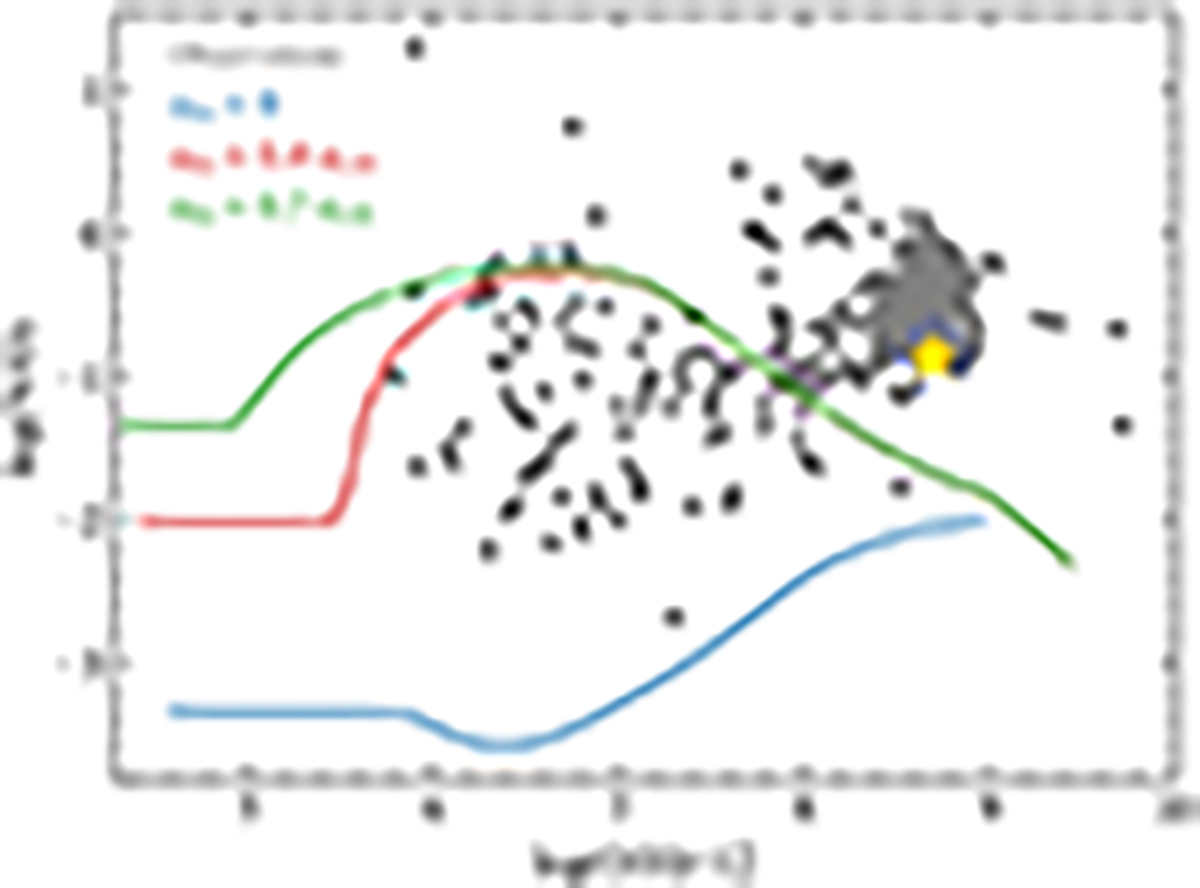
Fig. 12.
Download original image
Evolution of N/O as a function of O/H ratios for stellar models in the metallicity range of 0 ≤ Z ≤ 0.020 (coloured curves) and observed abundances of the Milky Way’s stars (grey points). Yields from models with different initial rotations were used (see Sect. 6.3). The observed data were taken from the SAGA database (Suda et al. 2008, 2011; Yamada et al. 2013). The yellow star represent the Sun’s abundances from Asplund et al. (2009).
Current usage metrics show cumulative count of Article Views (full-text article views including HTML views, PDF and ePub downloads, according to the available data) and Abstracts Views on Vision4Press platform.
Data correspond to usage on the plateform after 2015. The current usage metrics is available 48-96 hours after online publication and is updated daily on week days.
Initial download of the metrics may take a while.