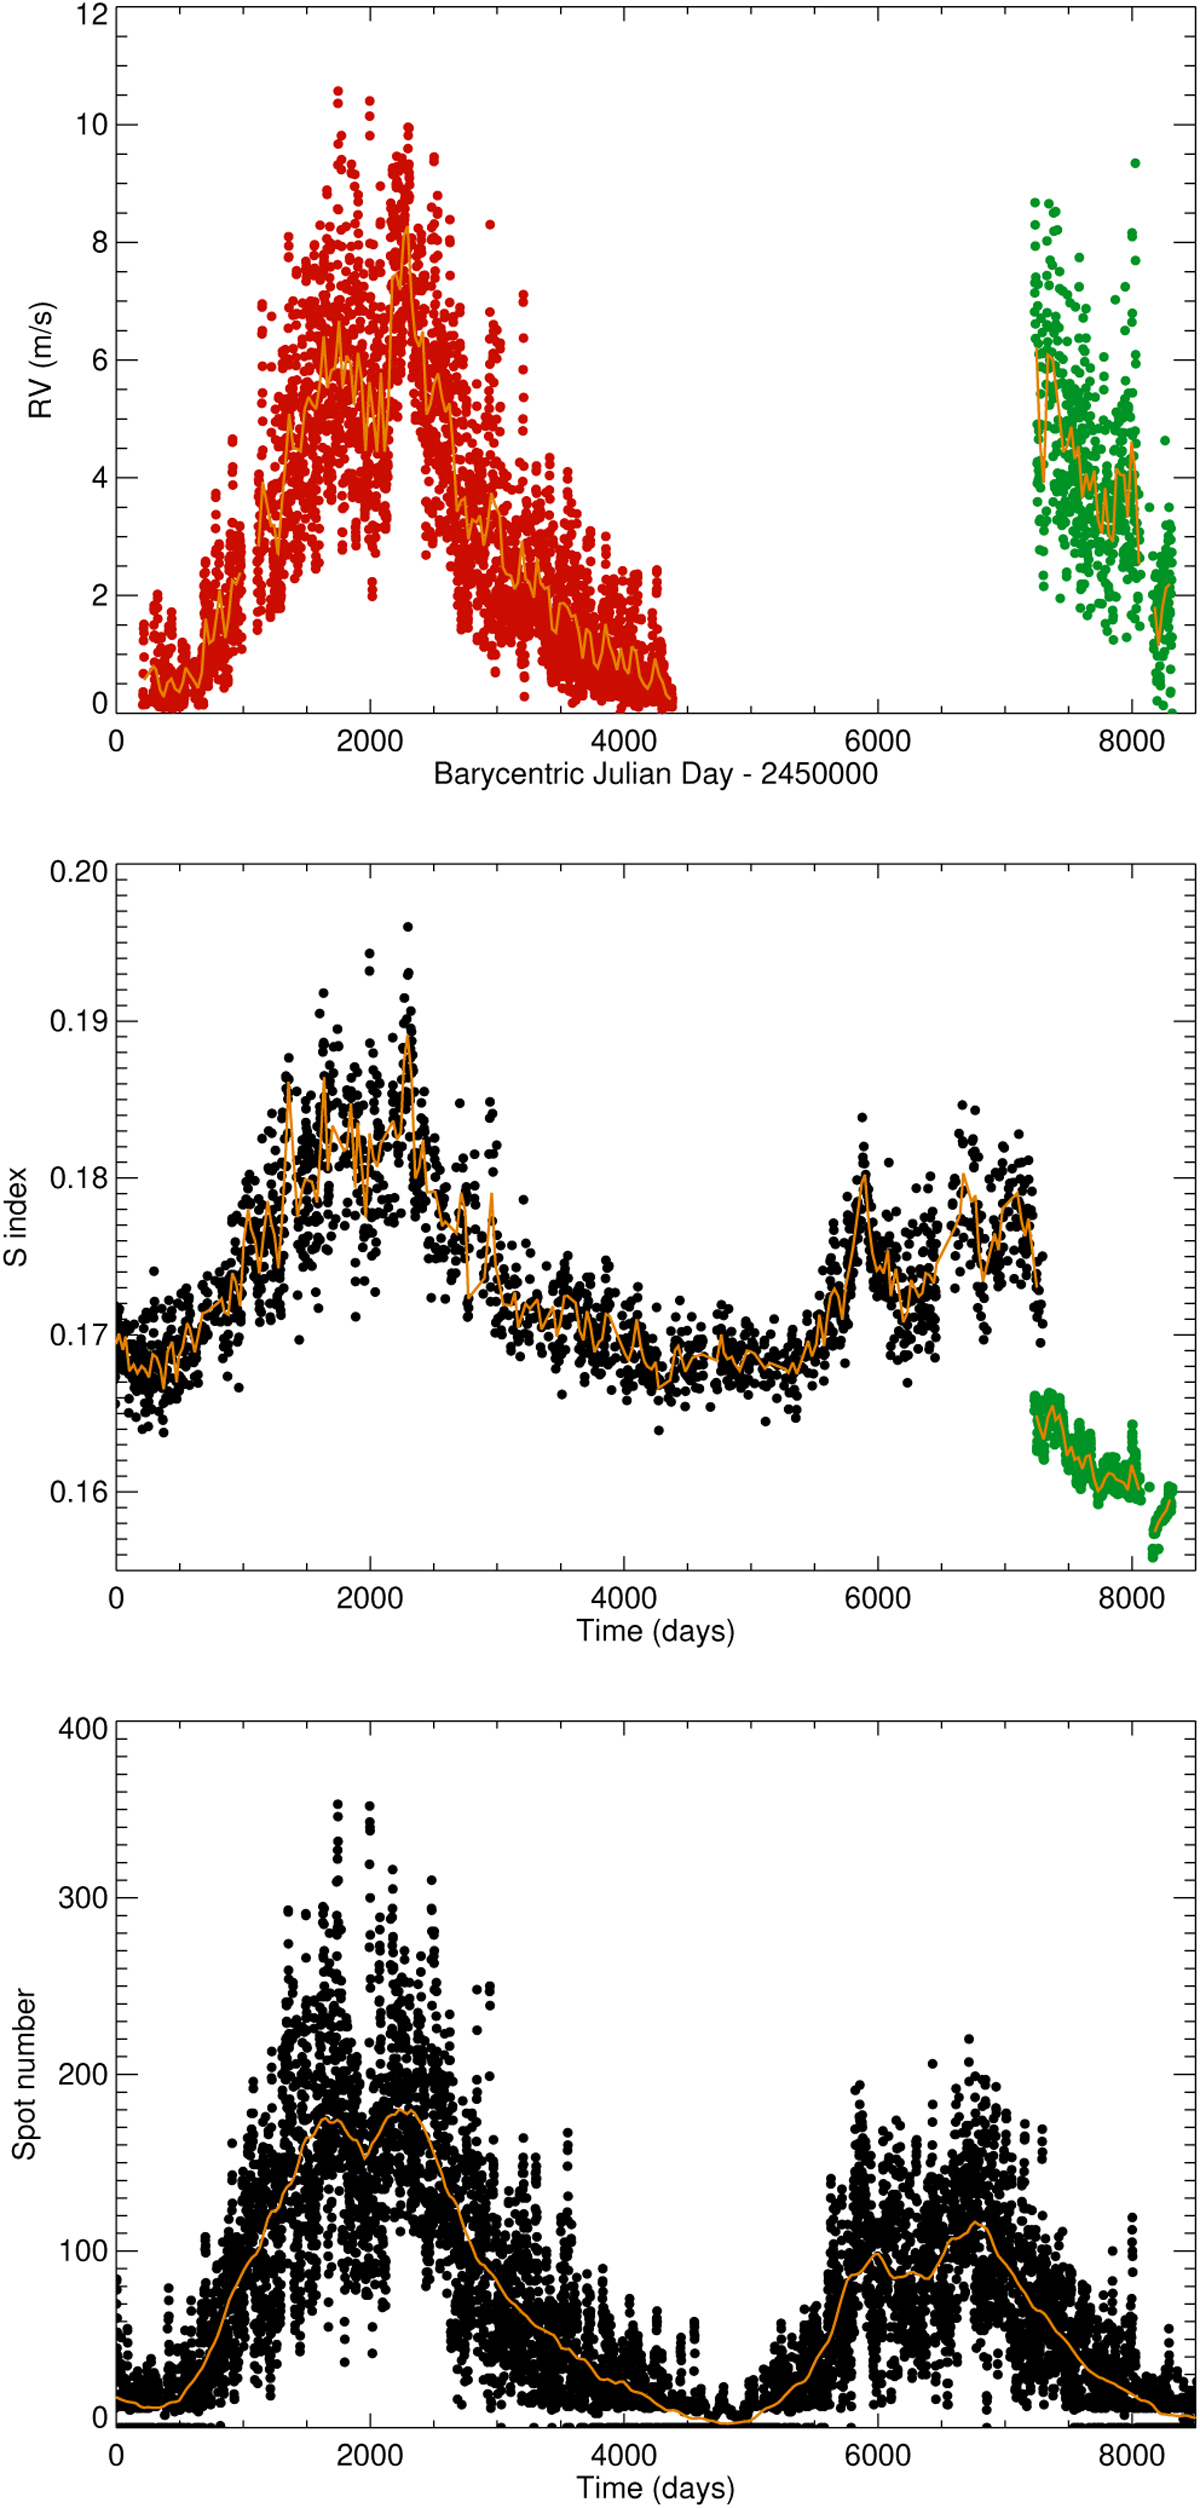
Fig. A.1
Download original image
Time series comparing cycle 23 model and cycle 24 observations. The orange lines represent smooth time series from a running average (over 28 d). The upper panel shows the model RV from Meunier et al. (2010a) in red and the HARPS-N observed RV in green. The middle panel shows the Sac Peak S-index (black) and the HARPS-N S-index (green). The last panel shows the Sunspot number from SILSO/SIDC (https://www.sidc.be/silso/) over cycles 23 and 24.
Current usage metrics show cumulative count of Article Views (full-text article views including HTML views, PDF and ePub downloads, according to the available data) and Abstracts Views on Vision4Press platform.
Data correspond to usage on the plateform after 2015. The current usage metrics is available 48-96 hours after online publication and is updated daily on week days.
Initial download of the metrics may take a while.