Fig. 8
Download original image
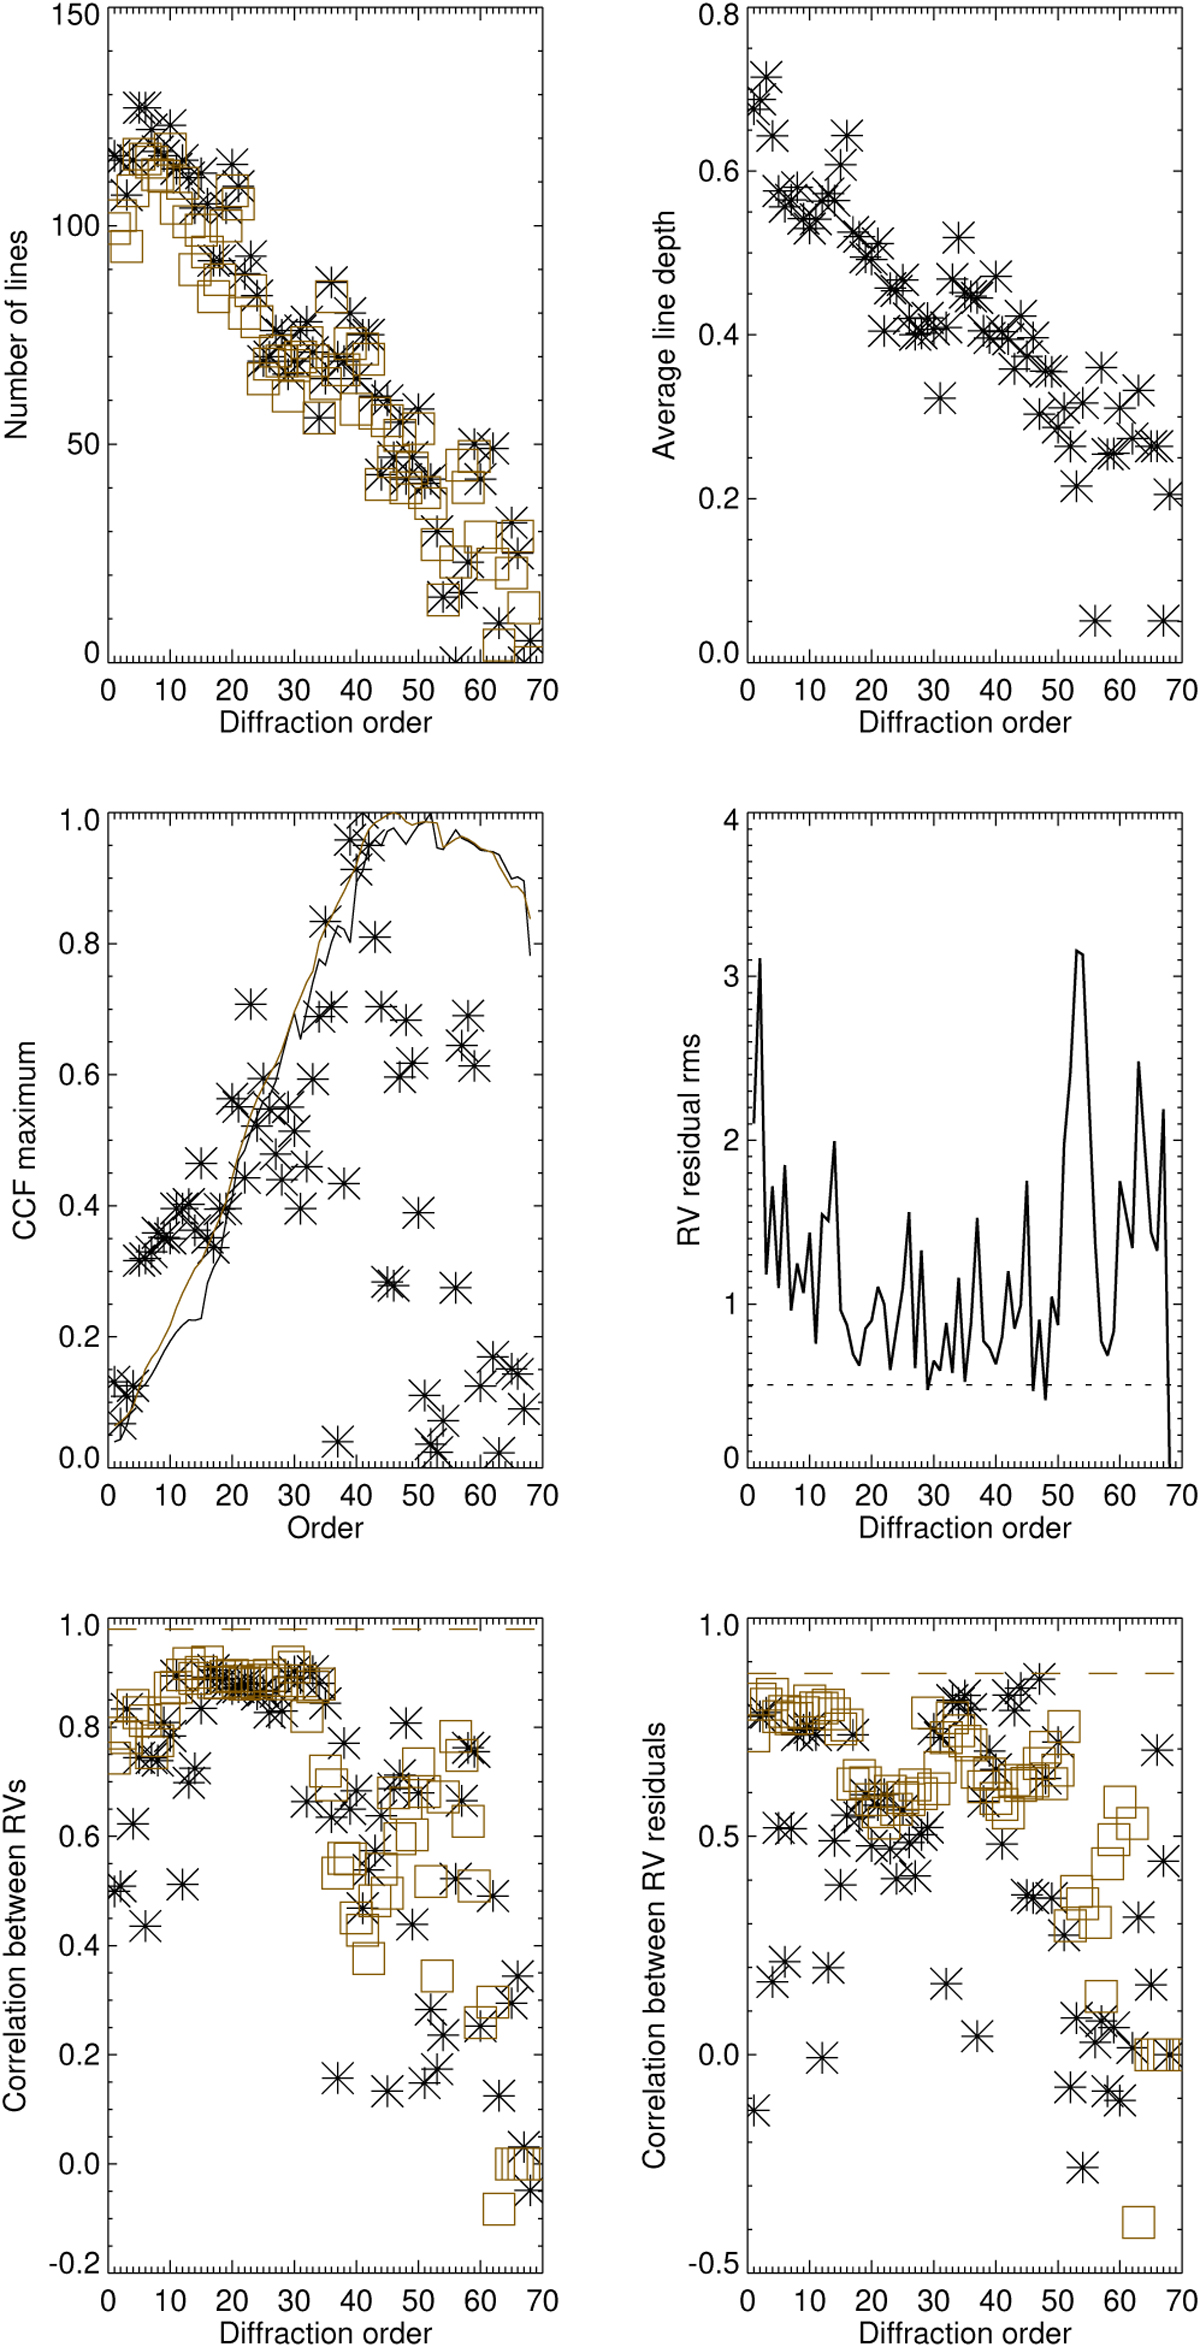
Properties of the spectra, RV, and residuals versus diffraction order. Figure shows the number of lines in the G2 DRS mask in black and in the line-by-line analysis in brown (first panel), average line depth (second panel), CCF maximum (normalised to 1, stars) and flux in the spectrum (normalised to 1, solid line), rms of the residuals after subtraction of the S-index model (solid line) and same residuals on the full DRS time series (horizontal dashed line), correlation between RV for each diffraction order with the DRS RV based on CCF (black) and line-byline analysis (brown), correlation between residuals (based on S-index model) for each diffraction order and the residuals for the full DRS time series based on CCF (black) and line-by-line analysis (brown). The horizontal brown dashed lines in the lower panels are the correlation between the reconstructed RV (respectively the residuals) on all diffraction orders for the line-by-line analysis and the DRS one.
Current usage metrics show cumulative count of Article Views (full-text article views including HTML views, PDF and ePub downloads, according to the available data) and Abstracts Views on Vision4Press platform.
Data correspond to usage on the plateform after 2015. The current usage metrics is available 48-96 hours after online publication and is updated daily on week days.
Initial download of the metrics may take a while.