Fig. 7
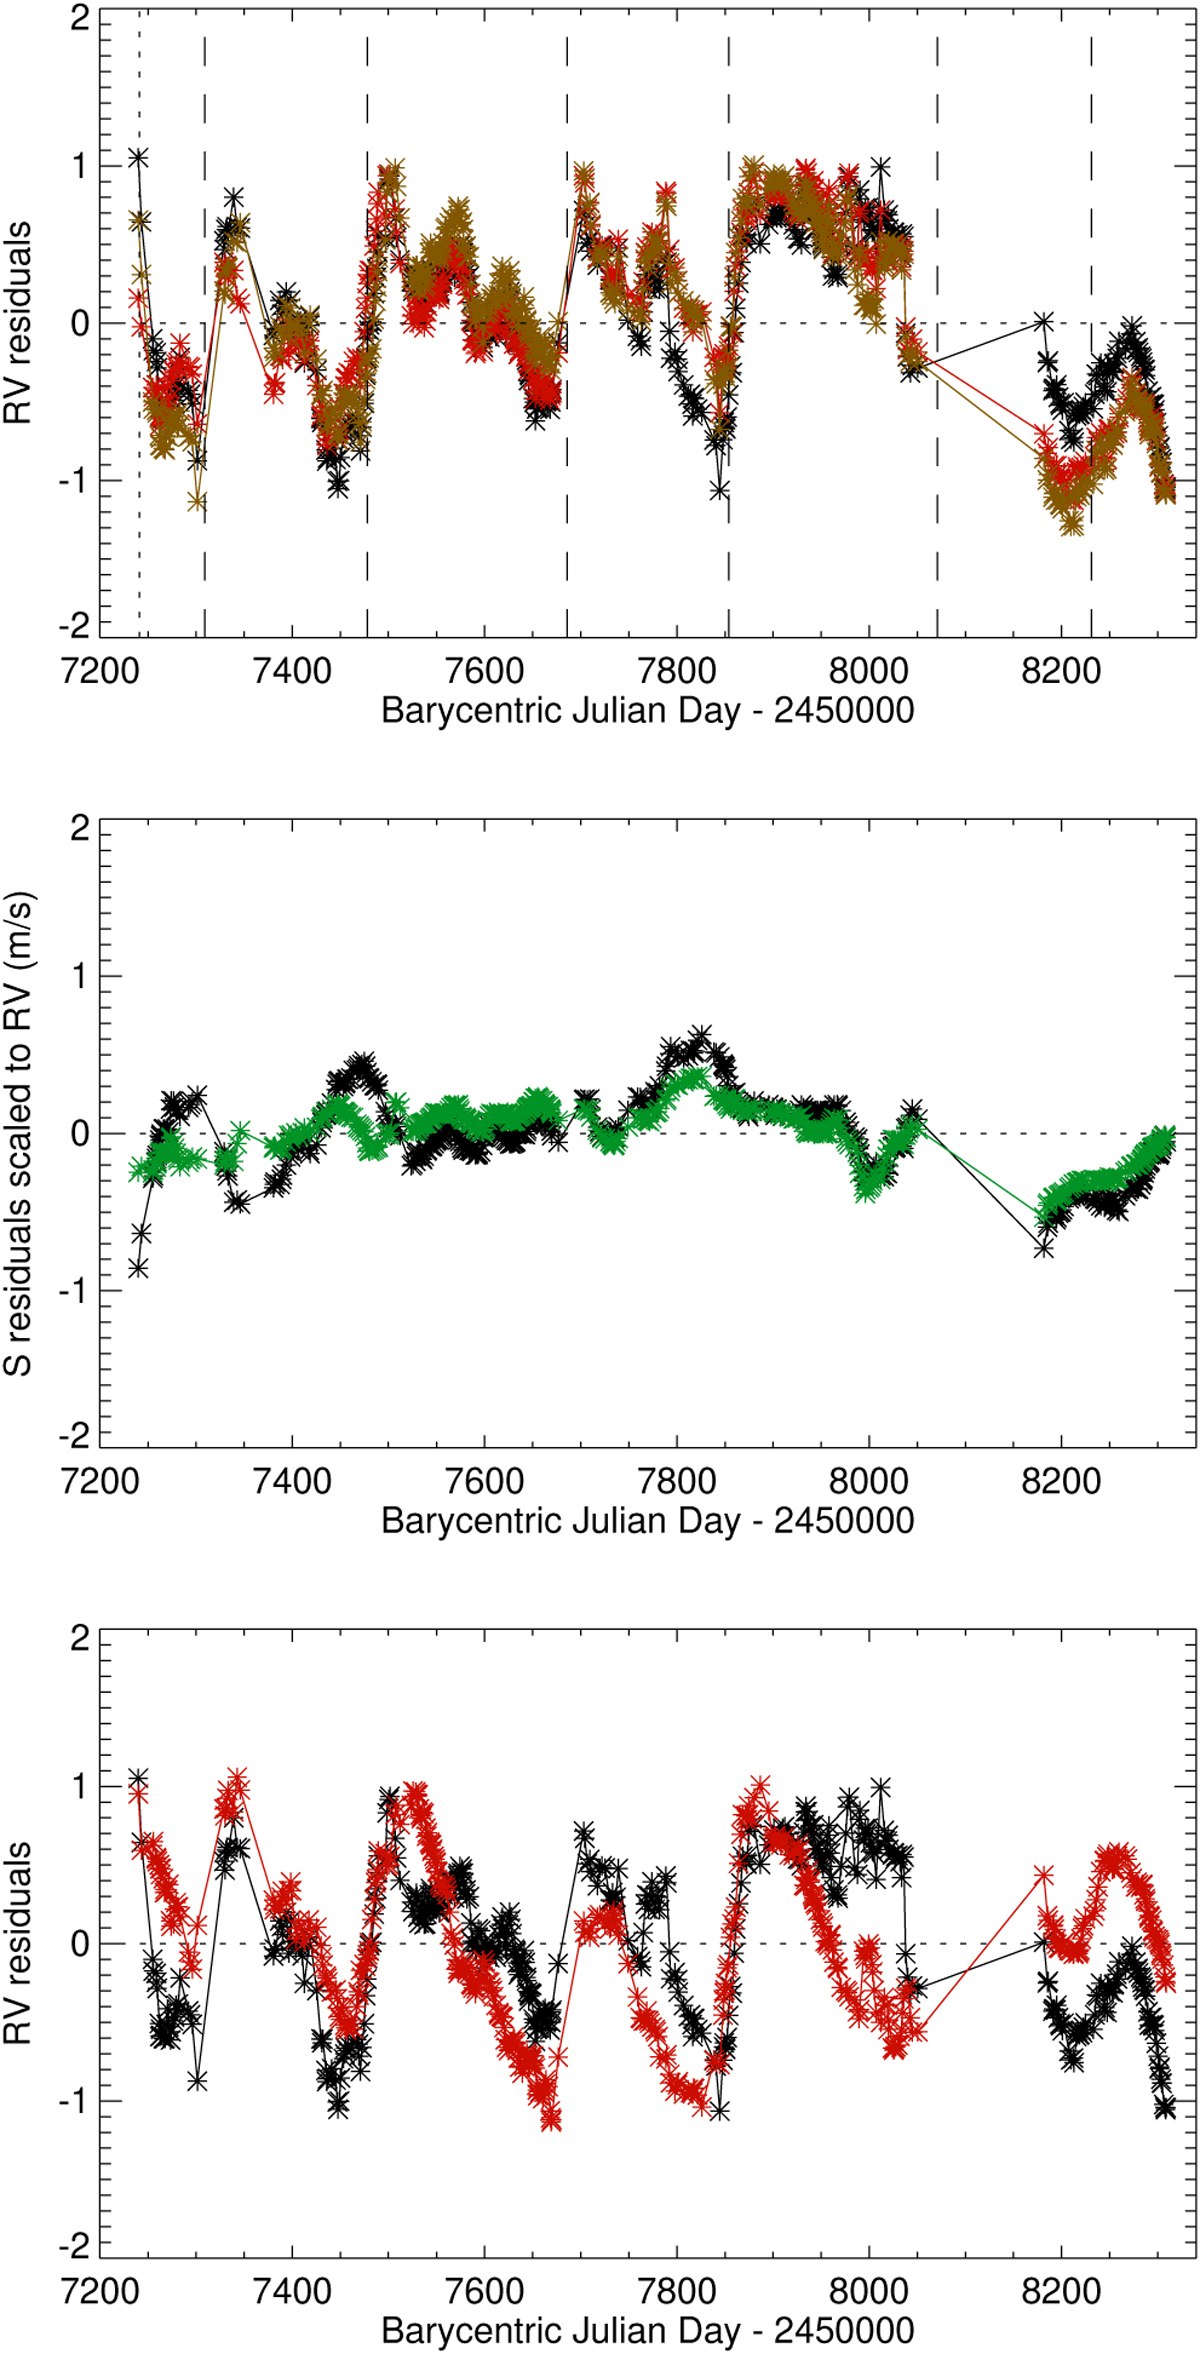
Download original image
RV residuals versus time after subtraction of the models (upper panel), based on the S-index (black), on the ff (red), and on |B|disk (brown). The dashed vertical lines indicate the time of instrument warm-up, and the dotted vertical line the time of power failure which is before day 8100 (Dumusque et al. 2021). The middle panel shows the S-index residuals scaled to RVs (based on ff in black and on |B|disk in green), on the same scale than the upper panel. The RV residuals based on the S-index model (in black) are compared to the BIS residuals (in red) in the lower panel.
Current usage metrics show cumulative count of Article Views (full-text article views including HTML views, PDF and ePub downloads, according to the available data) and Abstracts Views on Vision4Press platform.
Data correspond to usage on the plateform after 2015. The current usage metrics is available 48-96 hours after online publication and is updated daily on week days.
Initial download of the metrics may take a while.