Fig. 4

Download original image
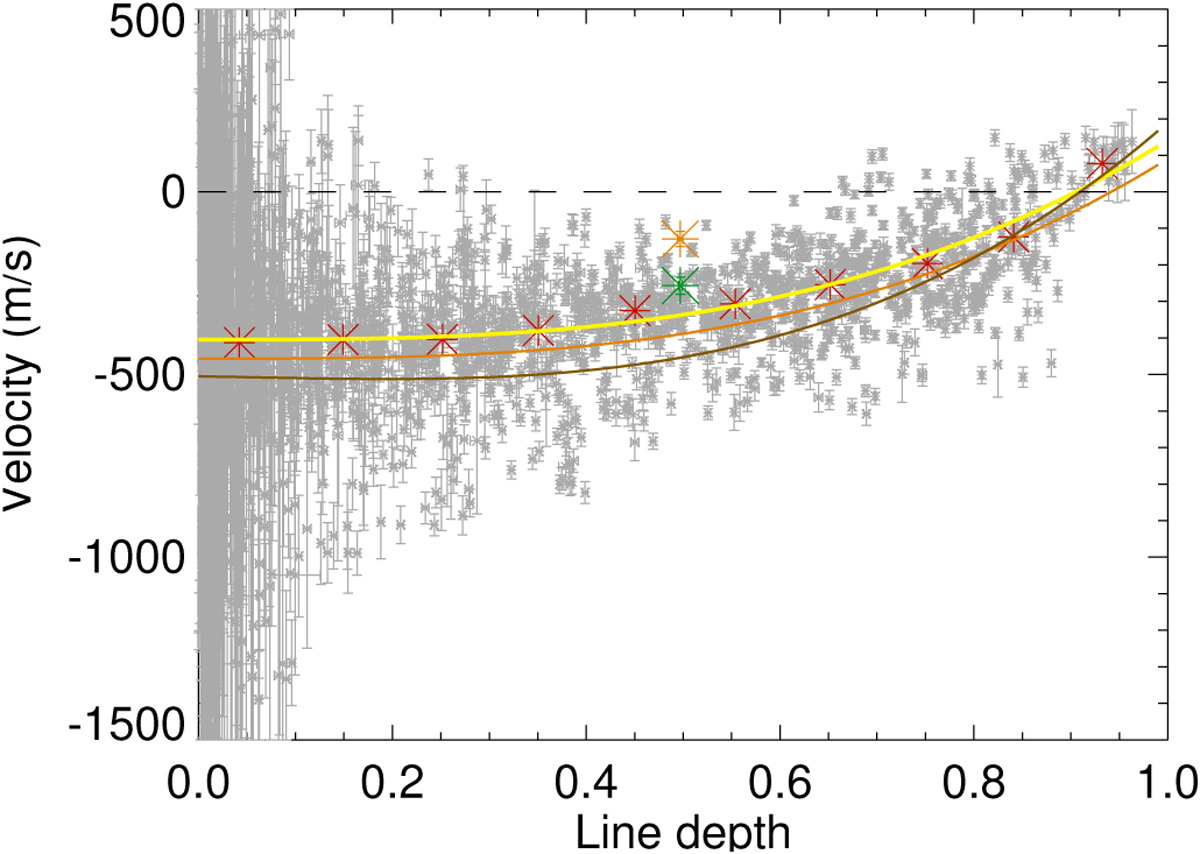
Velocities computed with respected to laboratory wavelengths versus line depth. Each point in gray corresponds to a spectral line, averaged over all spectra, after subtraction of a solar gravitational redshift of about 636 m s−1. The error bars indicate the 1-σ dispersion (and not the error on the average). The orange and green stars correspond to the 6768 Ni line (MDI/SOHO) and 6173 Fe line (HMI/SDO) respectively. The red stars show the average velocity in each bin in depth and the yellow line is a third degree polynomial fit on those points following the function proposed by Liebing et al. (2021). The y-scale has been restricted to 2 km s−1, and a few points are off-scale for very small line depths. The orange line is from Liebing et al. (2021) for HARPS spectral resolution and after subtraction of a gravitational redshift of about 636 m s−1, and the brown line is from Reiners et al. (2016), based on high resolution spectra.
Current usage metrics show cumulative count of Article Views (full-text article views including HTML views, PDF and ePub downloads, according to the available data) and Abstracts Views on Vision4Press platform.
Data correspond to usage on the plateform after 2015. The current usage metrics is available 48-96 hours after online publication and is updated daily on week days.
Initial download of the metrics may take a while.


