Fig. 3
Download original image
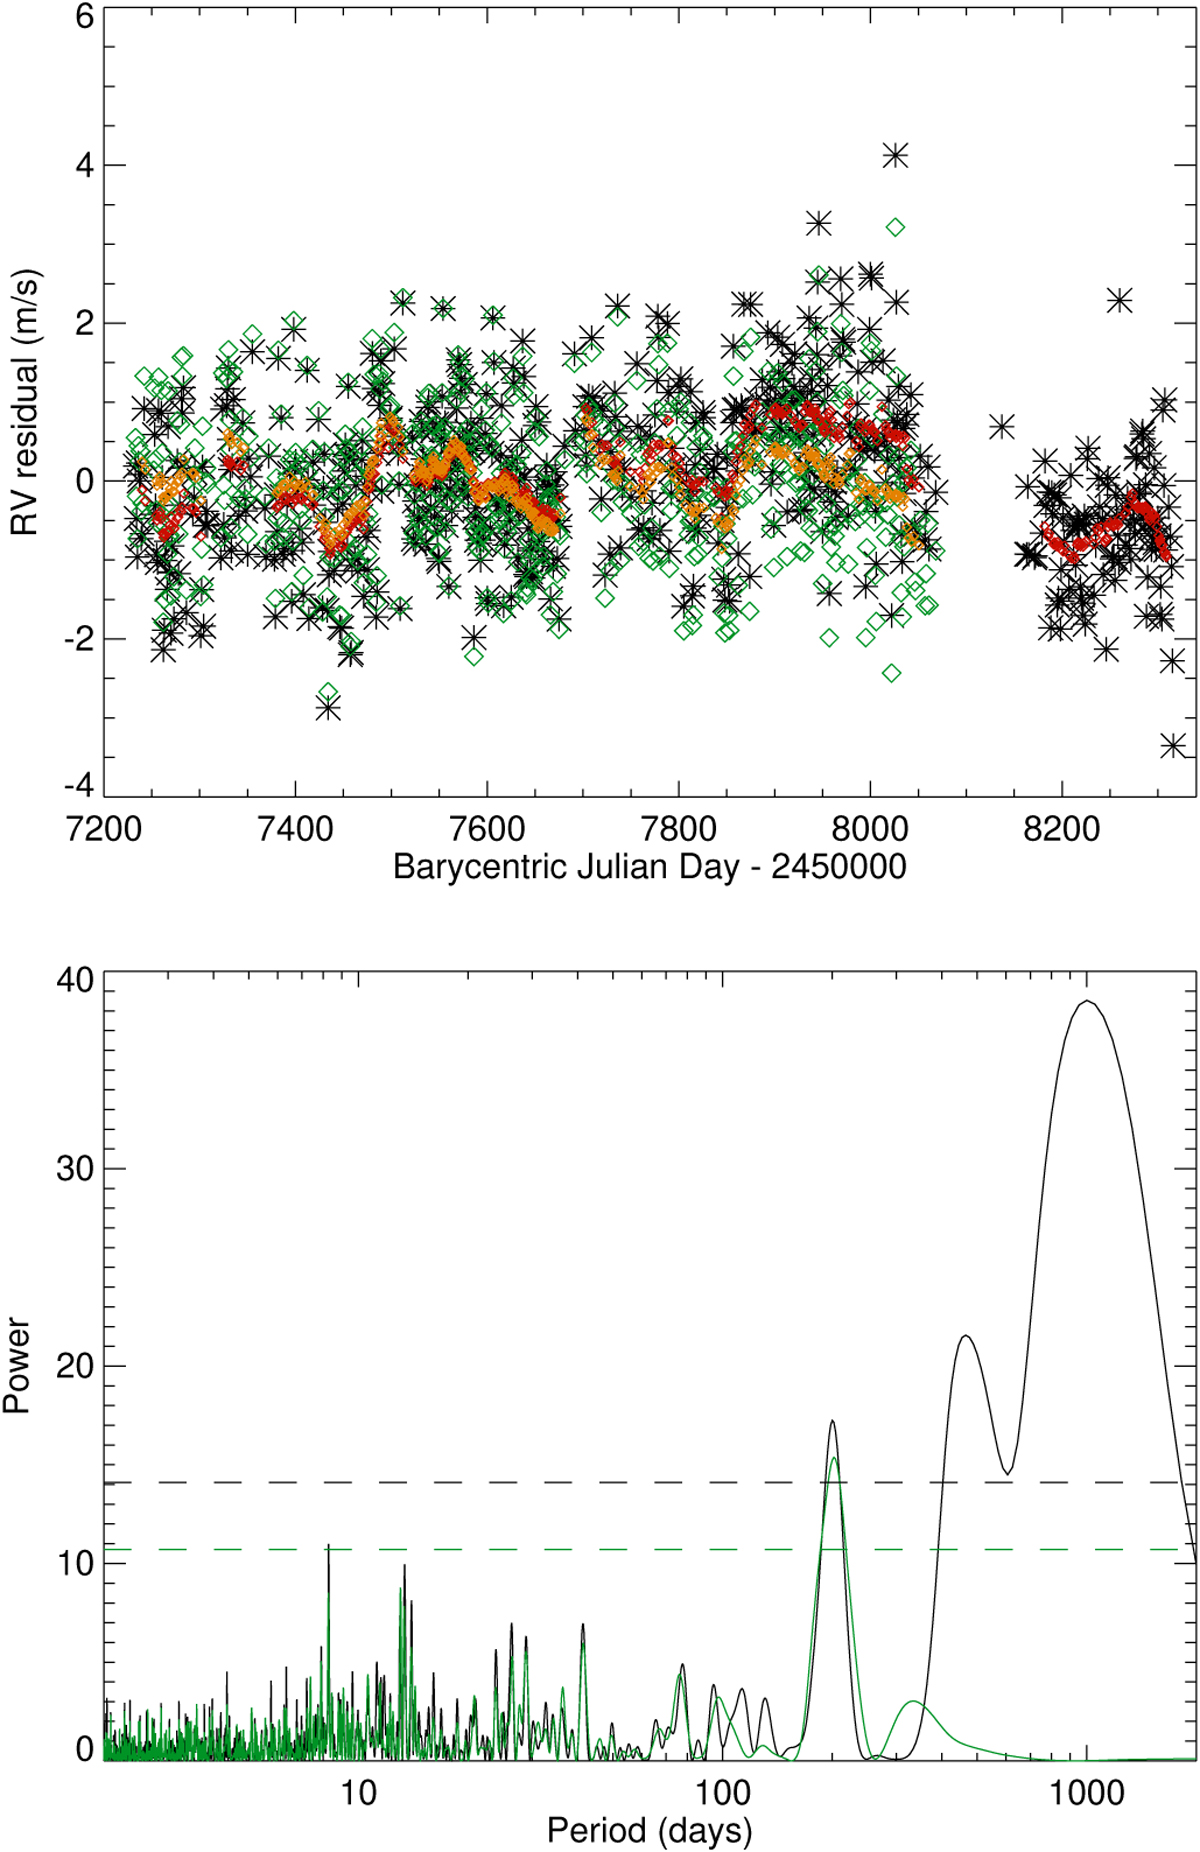
Residual RVs versus time (upper panel) and Lomb Scargle periodogram (lower panel) for the 2010 model and scaled following the three parameter fit in Eq. (2) from Sect. 3.1. The black stars and lines correspond to all days, and the green stars and lines to days before the interruption only. The red (resp. orange) points are the binned (over 28 days) residuals for the black (resp. green) points. The horizontal lines in the lower panel correspond to 0.1% fap level, based on a bootstrap analysis.
Current usage metrics show cumulative count of Article Views (full-text article views including HTML views, PDF and ePub downloads, according to the available data) and Abstracts Views on Vision4Press platform.
Data correspond to usage on the plateform after 2015. The current usage metrics is available 48-96 hours after online publication and is updated daily on week days.
Initial download of the metrics may take a while.