Open Access
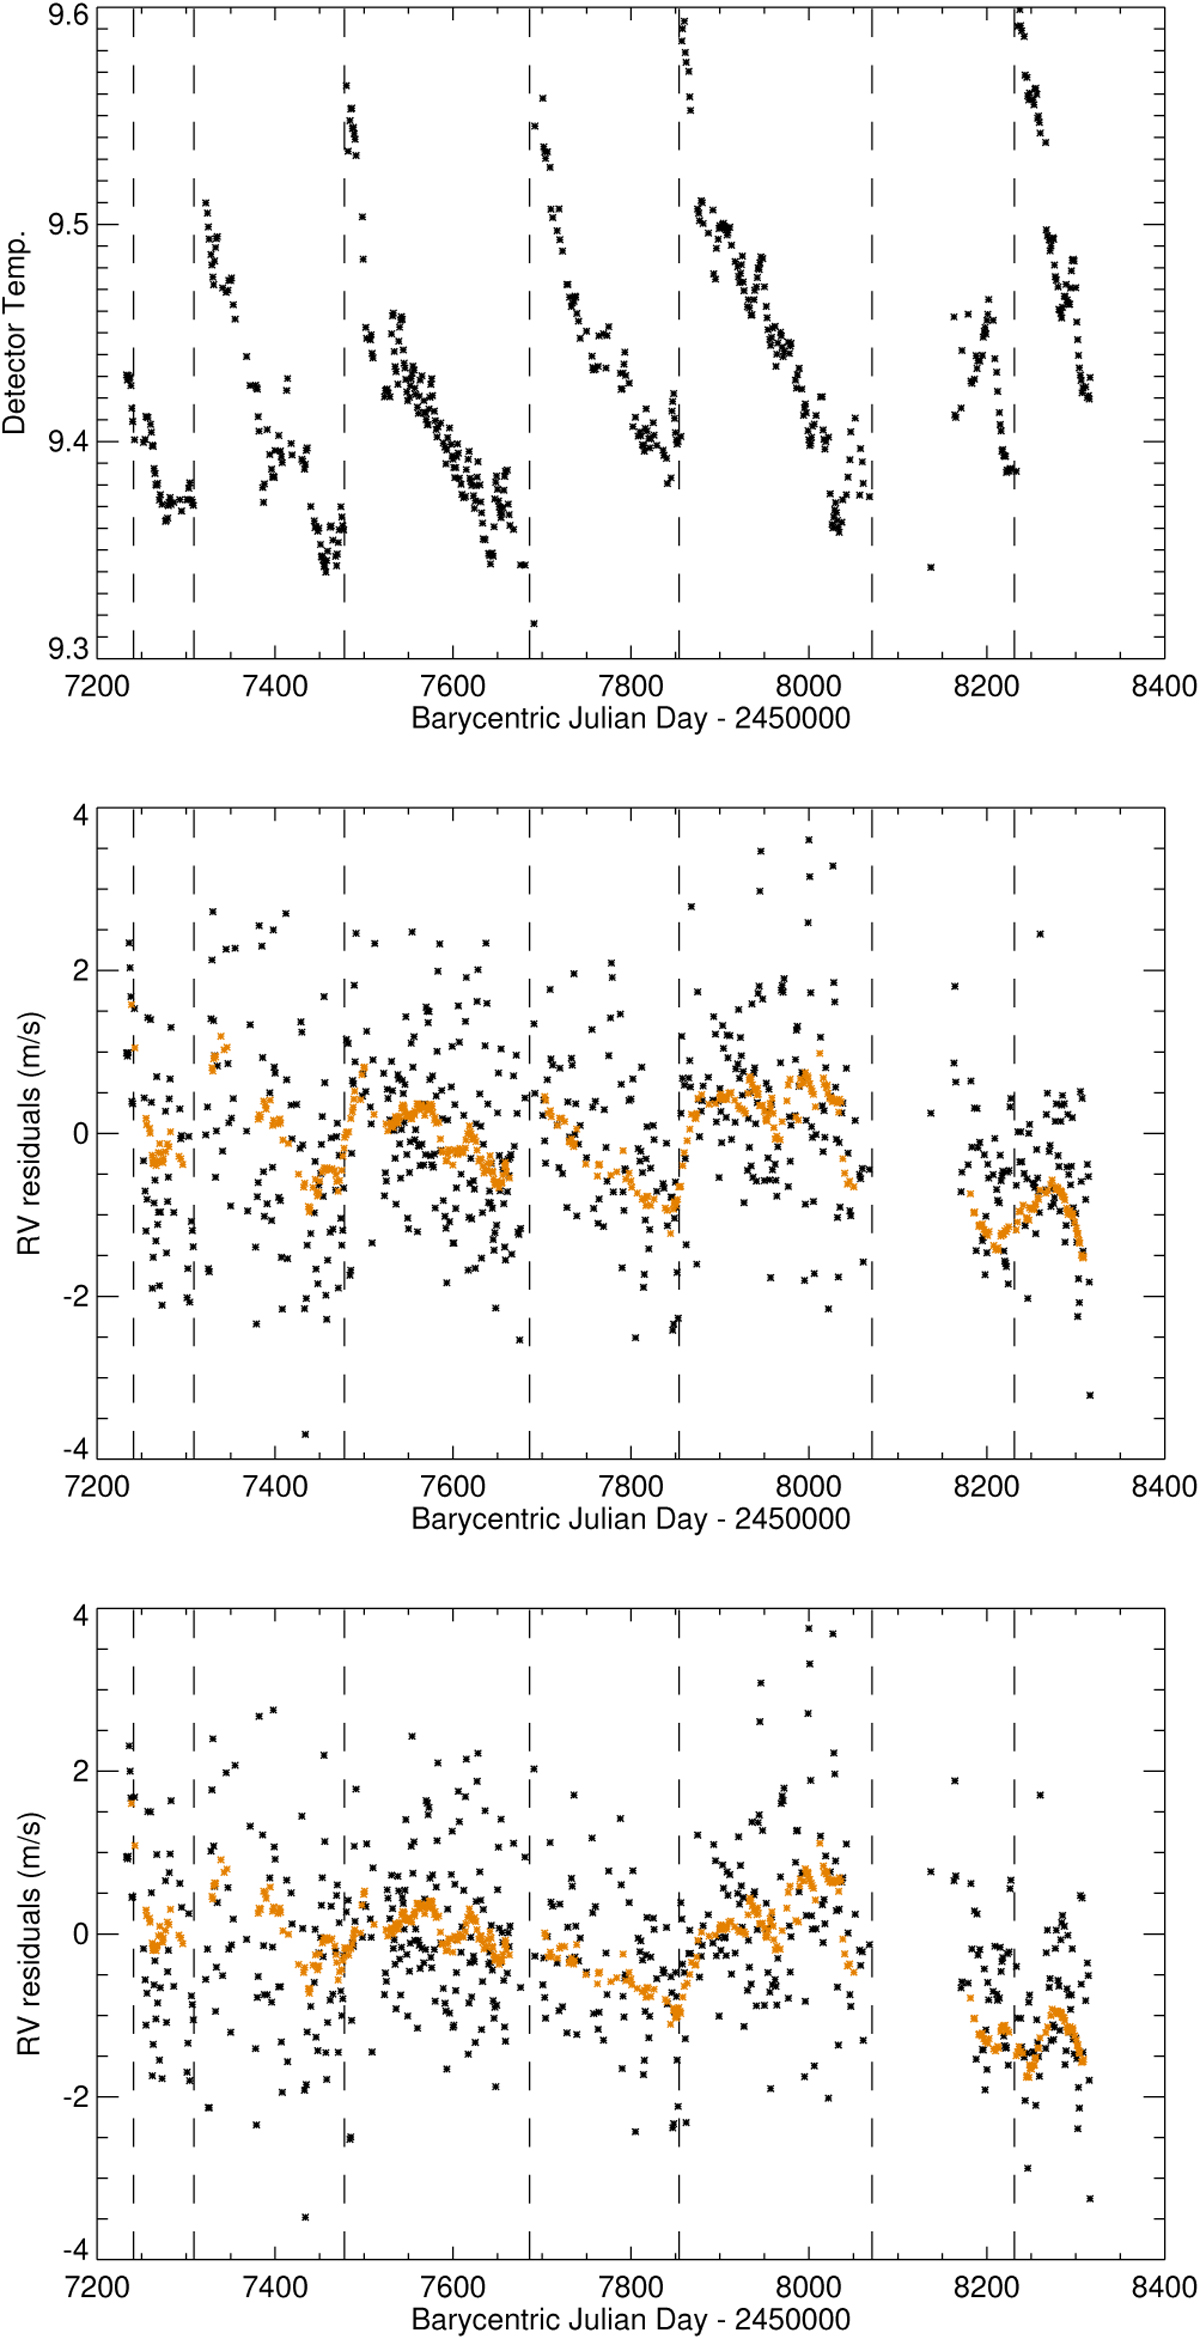
Fig. E.1
Download original image
Daily time series of the detector temperature from the file headers (upper panel), of the RV residuals based on a linear model based on the S-index (middle panels) and after an additional correction based on the detector temperature (lower panels). The orange dots correspond to the smoothed residuals (over 28 days).
Current usage metrics show cumulative count of Article Views (full-text article views including HTML views, PDF and ePub downloads, according to the available data) and Abstracts Views on Vision4Press platform.
Data correspond to usage on the plateform after 2015. The current usage metrics is available 48-96 hours after online publication and is updated daily on week days.
Initial download of the metrics may take a while.