Fig. 1
Download original image
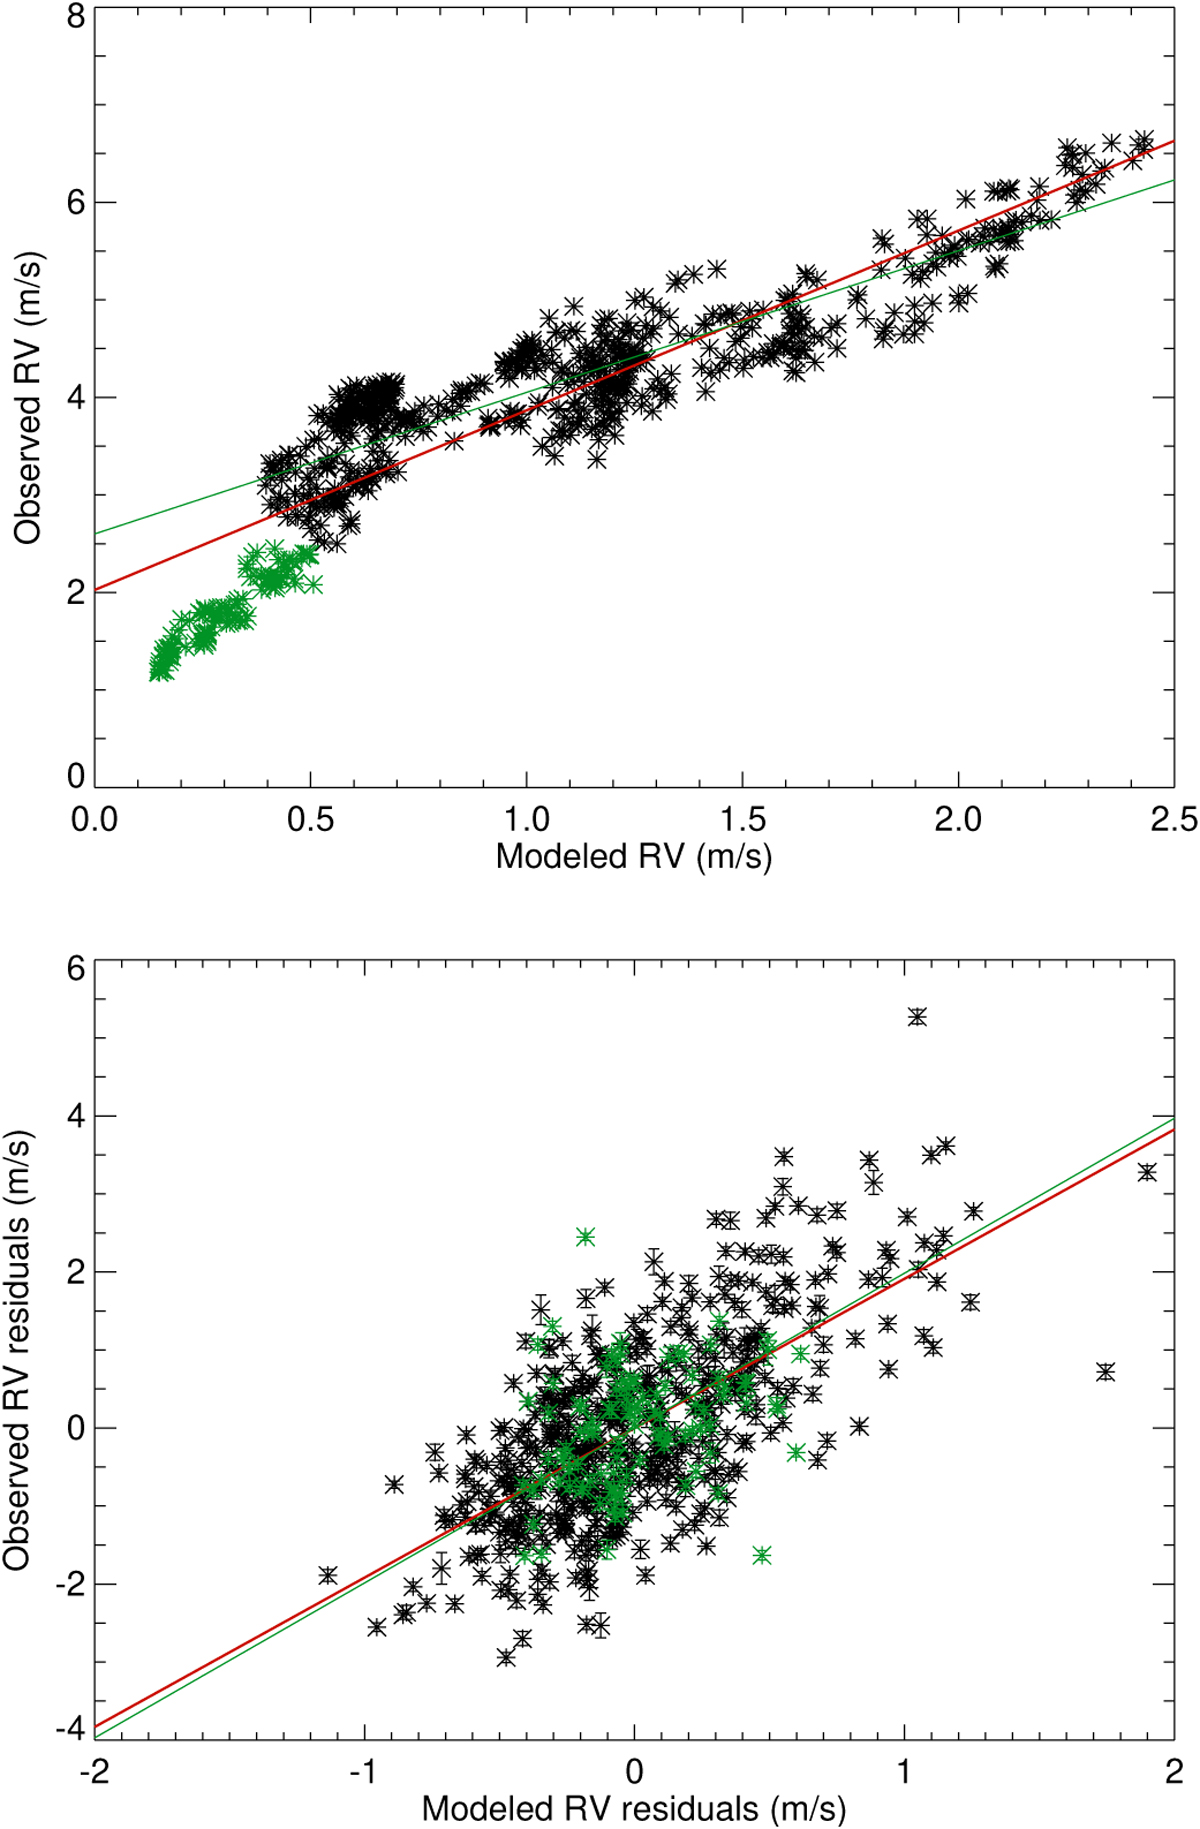
Observed binned RV versus modelled binned RV (upper panel) and residuals (lower panel). The binning was done over 28 days. The model uses the 2010 prescription for the amplitude of the convective blueshift inhibition. Red lines are linear fits on all days. Green points correspond to observations performed after the interruption, and the green lines are linear fits without those days.
Current usage metrics show cumulative count of Article Views (full-text article views including HTML views, PDF and ePub downloads, according to the available data) and Abstracts Views on Vision4Press platform.
Data correspond to usage on the plateform after 2015. The current usage metrics is available 48-96 hours after online publication and is updated daily on week days.
Initial download of the metrics may take a while.