Fig. 10
Download original image
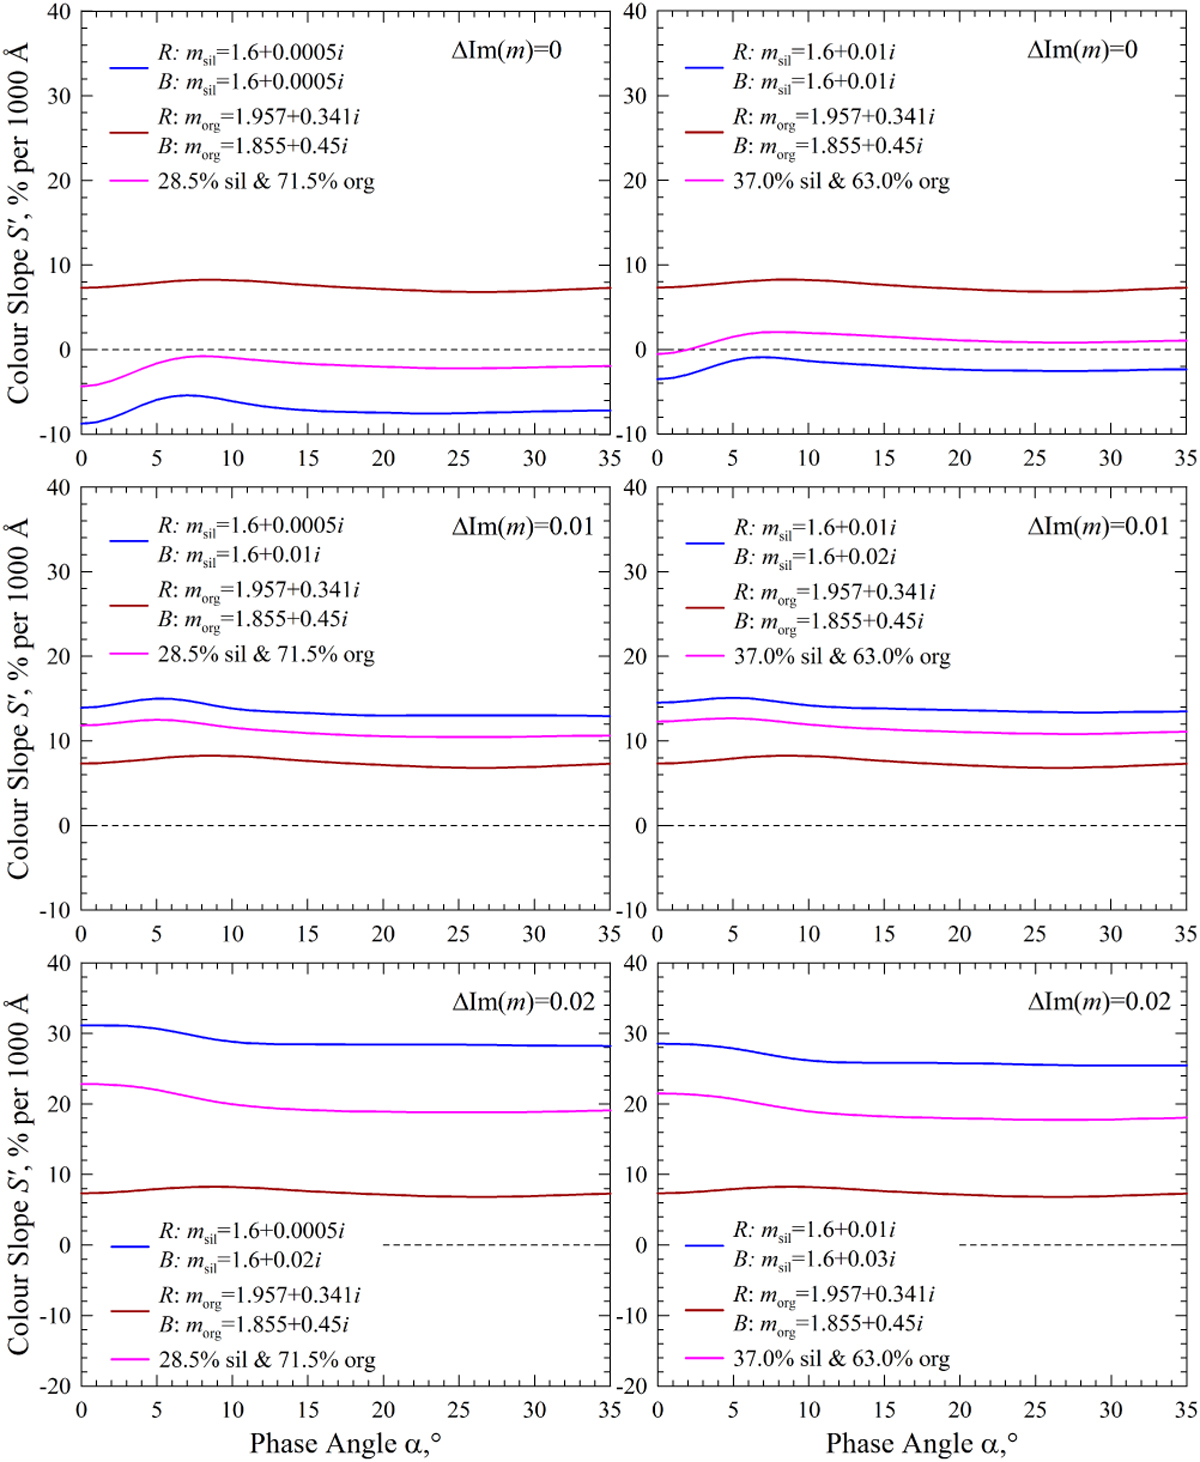
Color slope S′(B − R) as a function of phase angle α. The left columns correspond to silicate particles of m = 1.6 + 0.0005i, and the right columns correspond to silicate particles of m = 1.6 + 0.01i in red light. The different rows correspond to a different increment of the imaginary part of refractive index ΔIm(m) in blue light ΔIm(m) = 0 (top), 0.1 (middle), and 0.2 (bottom). The organic component was set to m = 1.957 + 0.341i in red light and m = 1.855 + 0.45i in blue light everywhere. The blue and brown curves demonstrate the color slope of the Mg-rich silicate particles and organic particles, respectively. The magenta curves show the result when they are mixed.
Current usage metrics show cumulative count of Article Views (full-text article views including HTML views, PDF and ePub downloads, according to the available data) and Abstracts Views on Vision4Press platform.
Data correspond to usage on the plateform after 2015. The current usage metrics is available 48-96 hours after online publication and is updated daily on week days.
Initial download of the metrics may take a while.