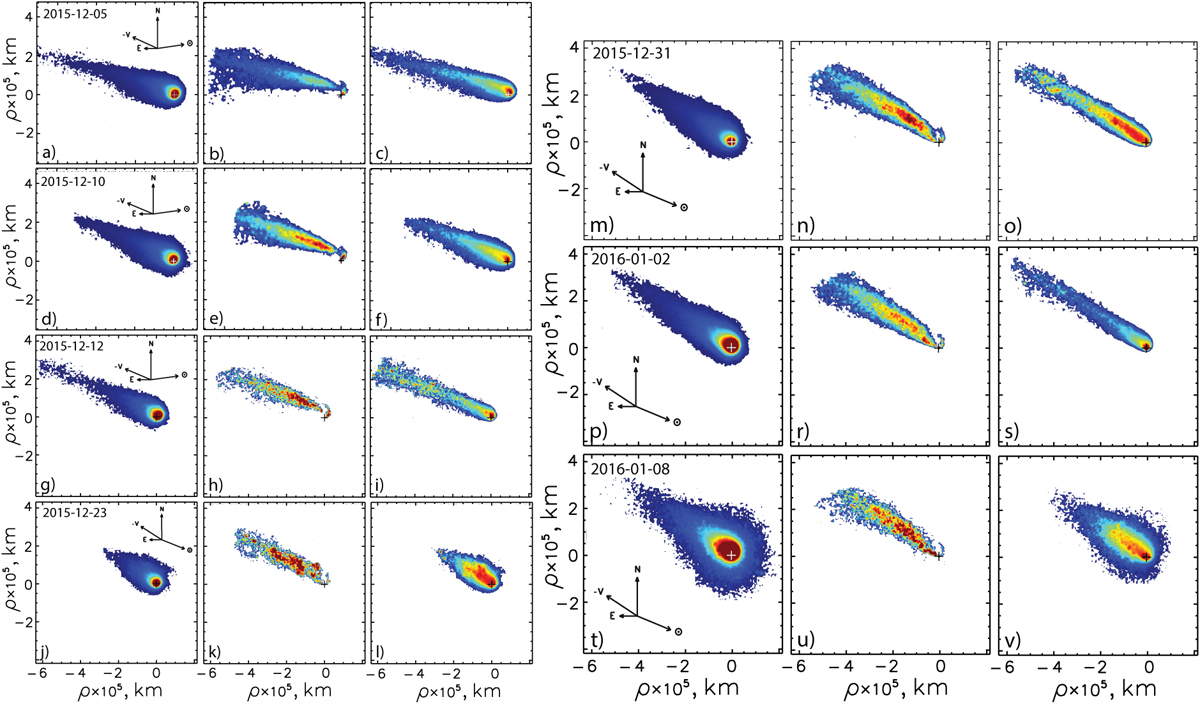
Fig. 1

Download original image
Intensity maps of comet C/2013 X1 (PANSARRS) obtained at the Skalnaté Pleso observatory in the R filter from December 2015 to January 2016 (the dates are indicated in the left panels for each day). The left panels show direct images of the comet. The center panels show the operation of digital filters using the rotational gradient method (Larson & Sekanina 1984). The right panels show the results divided by the averaged profile (Samarasinha & Larson 2014). North, east, the Sun, and the cometary motion are indicated.
Current usage metrics show cumulative count of Article Views (full-text article views including HTML views, PDF and ePub downloads, according to the available data) and Abstracts Views on Vision4Press platform.
Data correspond to usage on the plateform after 2015. The current usage metrics is available 48-96 hours after online publication and is updated daily on week days.
Initial download of the metrics may take a while.


