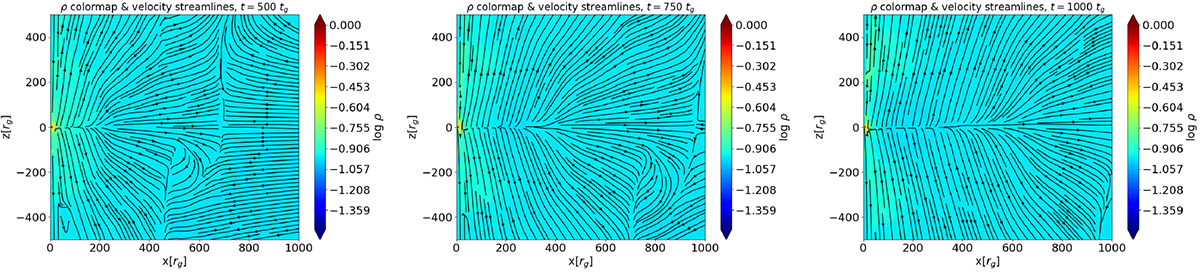
Fig. 6.
Download original image
Density color maps overplotted with the velocity streamlines for one of our representative models, b01.a99.2D, up to a radius of 1000rg showing the outflows extending to larger scales (eventually to the outer boundary of the computational domain) at time t = 500, 750, and 1000tg. The equatorial outflow marked by the outward velocity streamline expands in time as the simulation proceeds. Shocks are visible in the velocity field structure.
Current usage metrics show cumulative count of Article Views (full-text article views including HTML views, PDF and ePub downloads, according to the available data) and Abstracts Views on Vision4Press platform.
Data correspond to usage on the plateform after 2015. The current usage metrics is available 48-96 hours after online publication and is updated daily on week days.
Initial download of the metrics may take a while.