Fig. 2.
Download original image
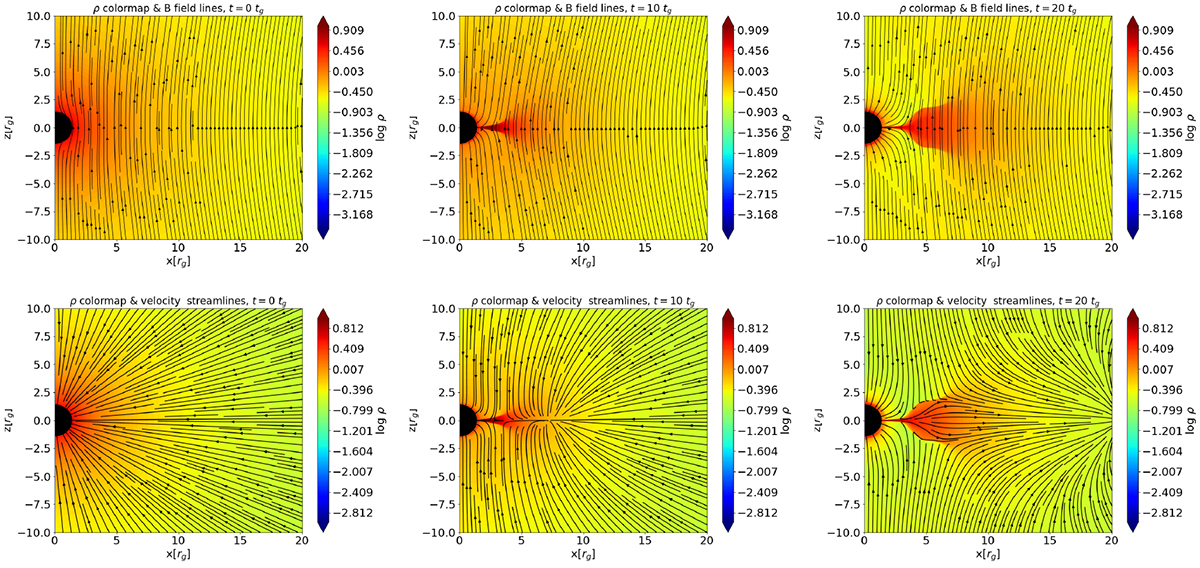
Initial and evolved states of our fiducial model (b01.a90.2D, i.e., with β = 0.1 and a = 0.90) after the magnetic field was turned on, with fluid density in color contours with the magnetic field lines plotted on top (top row) and velocity streamlines overplotted (bottom row). The top panel demonstrates magnetic reconnection events in the equatorial region, and the bottom panel shows the outflows that developed and proceeded outward.
Current usage metrics show cumulative count of Article Views (full-text article views including HTML views, PDF and ePub downloads, according to the available data) and Abstracts Views on Vision4Press platform.
Data correspond to usage on the plateform after 2015. The current usage metrics is available 48-96 hours after online publication and is updated daily on week days.
Initial download of the metrics may take a while.