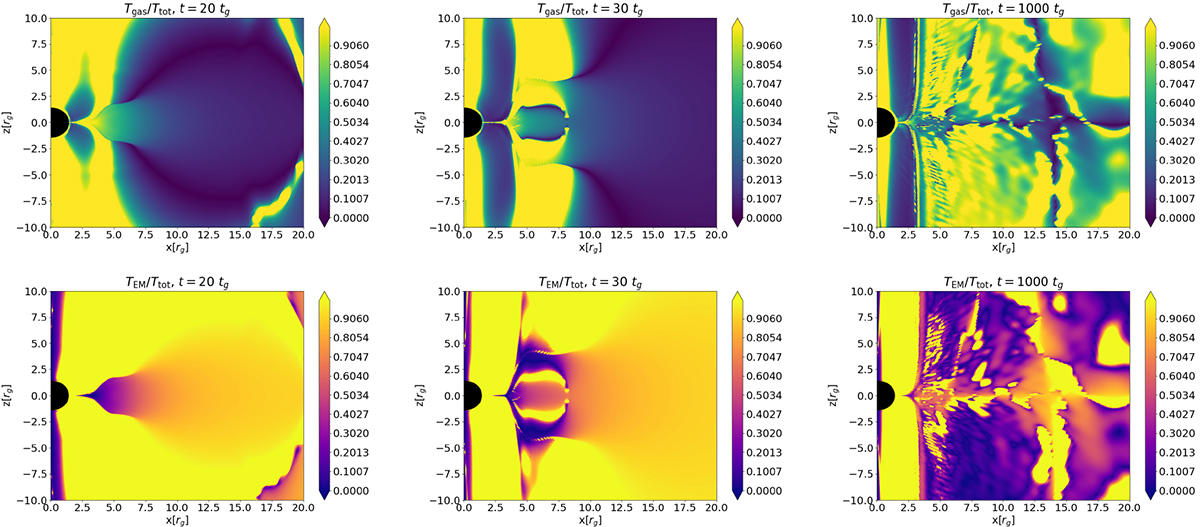
Fig. 11.
Download original image
Energy composition of the developed outflows in the representative model b01.a90.2D. The plots show the ratio of the matter (top row) and electromagnetic energy (bottom row) to the total energy at chosen time instances of 20, 30, and 1000tg. While the system is relatively organized at the beginning of the evolution, turbulent behavior gradually prevails in the course of time. Large-scale structures are still seen in the equatorial plane and along the axis, although no well-defined jet develops in this simulation. The value in the color-scale represents a fraction ranging from 0 to 1.
Current usage metrics show cumulative count of Article Views (full-text article views including HTML views, PDF and ePub downloads, according to the available data) and Abstracts Views on Vision4Press platform.
Data correspond to usage on the plateform after 2015. The current usage metrics is available 48-96 hours after online publication and is updated daily on week days.
Initial download of the metrics may take a while.