Fig. 8
Download original image
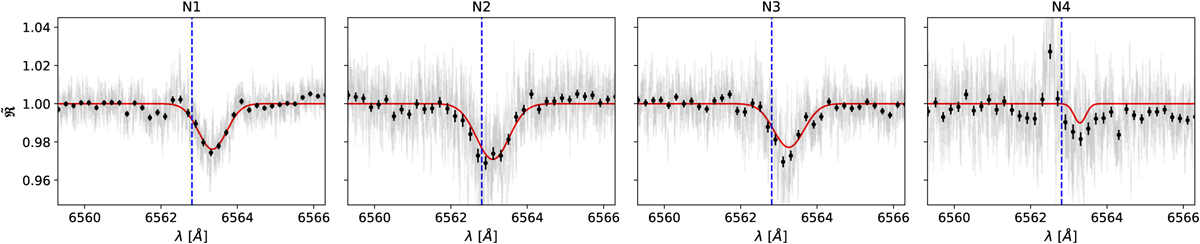
Transmission spectra of HAT-P-67 b for each night. The spectra are centred around the Hα line in the planetary rest frame (light grey) and also binned 20 times (in black circles). The red line is the MCMC Gaussian fit performed by SLOPpy, while the vertical blue dashed line indicates the rest frame transition wavelength of the Hα line.
Current usage metrics show cumulative count of Article Views (full-text article views including HTML views, PDF and ePub downloads, according to the available data) and Abstracts Views on Vision4Press platform.
Data correspond to usage on the plateform after 2015. The current usage metrics is available 48-96 hours after online publication and is updated daily on week days.
Initial download of the metrics may take a while.