Open Access
Fig. 7
Download original image
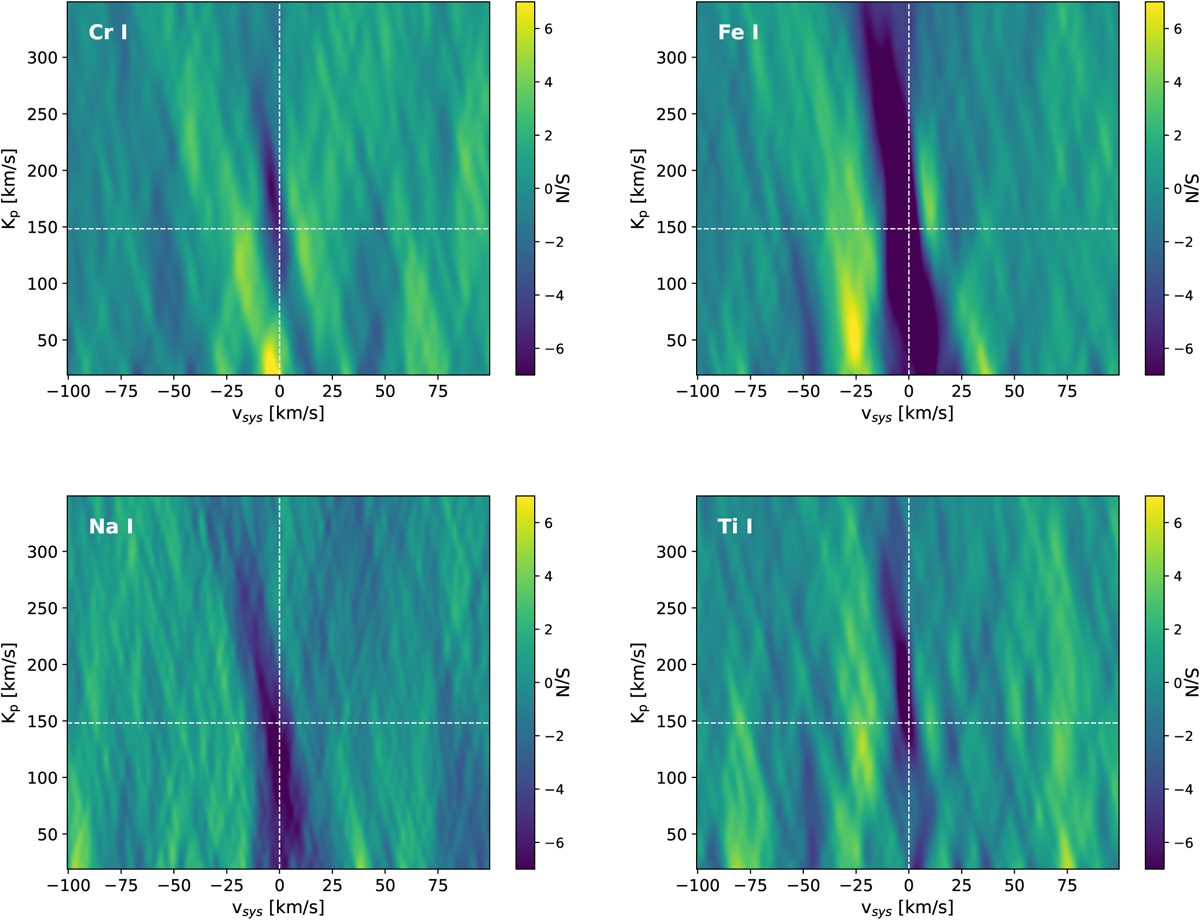
Planes of Kp−υsys obtained by combining all nights for the Cr I (top left), Fe I (top right), Na I (bottom left), and Ti I (bottom right) templates. In each plot, the dashed cross marks the expected Kp and vsys of the system.
Current usage metrics show cumulative count of Article Views (full-text article views including HTML views, PDF and ePub downloads, according to the available data) and Abstracts Views on Vision4Press platform.
Data correspond to usage on the plateform after 2015. The current usage metrics is available 48-96 hours after online publication and is updated daily on week days.
Initial download of the metrics may take a while.