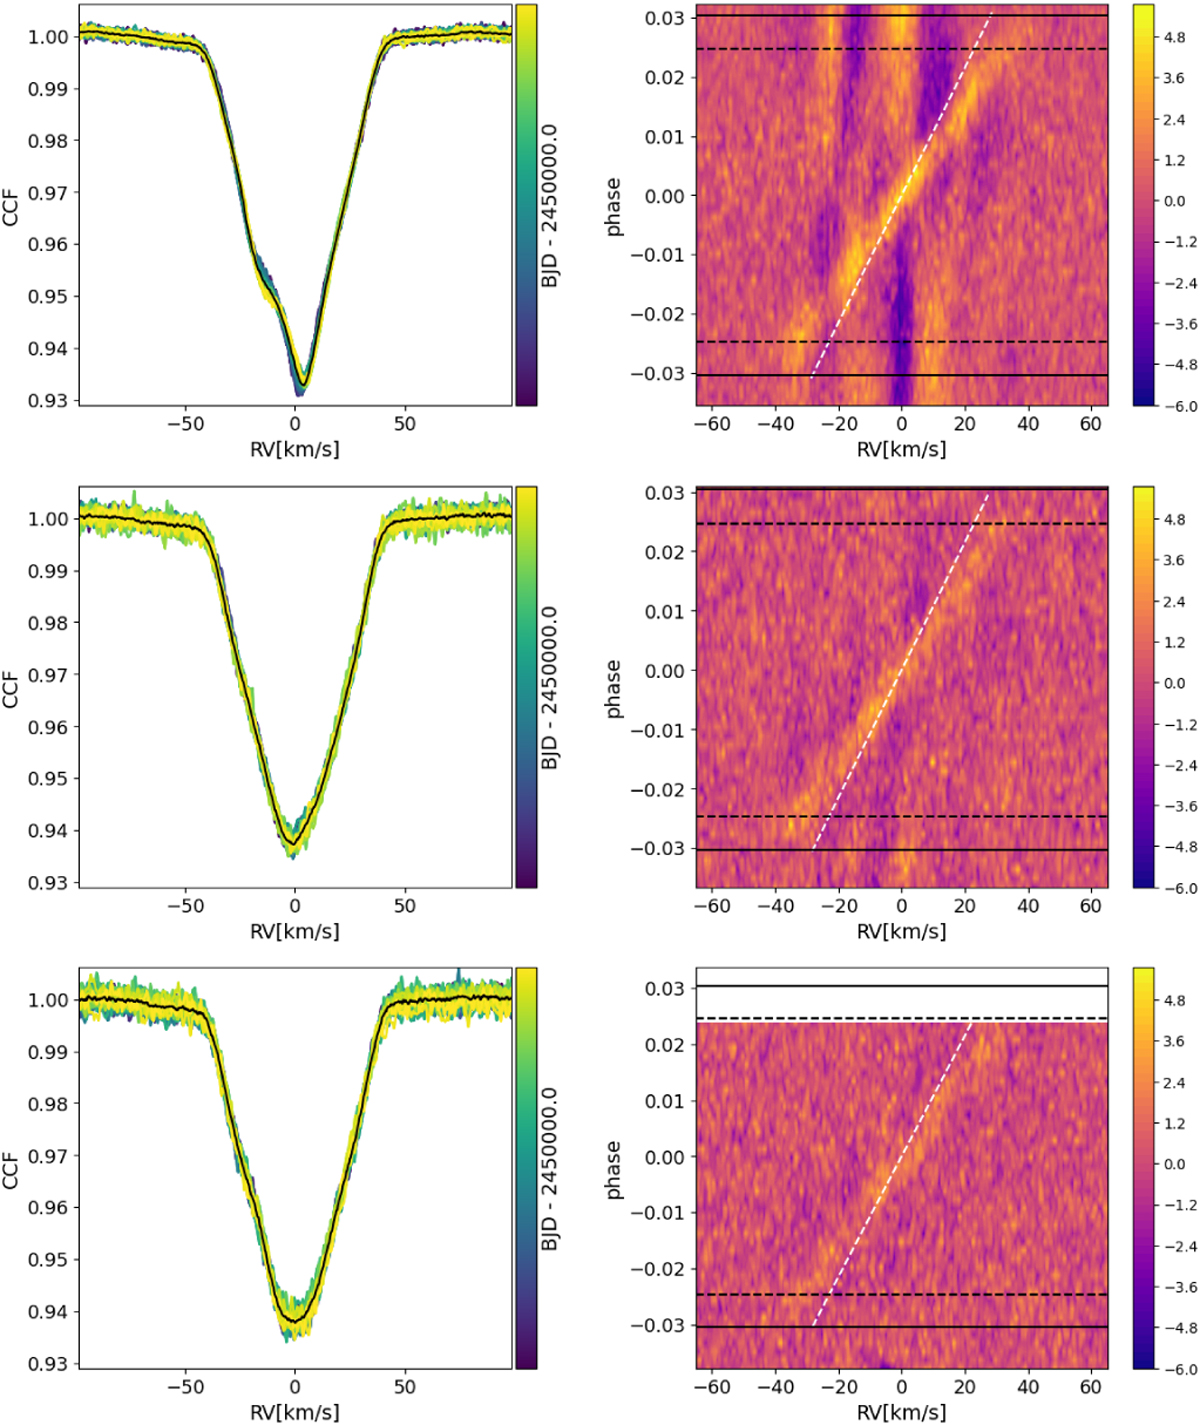
Fig. 4
Download original image
Cross-correlation function for N1 (first row), N3 (second row), and N4 (third row) extracted from the DRS using a G2 mask. Left: cross-correlation function linear profiles as a function of time. The black line indicates the average CCF. Right: two-dimensional maps of the CCFs as a function of orbital phase and RV in the stellar rest frame. The four horizontal black lines show the times of transit contacts. The straight white line shows the expected planetary Keplerian velocity Kp using a planetary mass value of ~0.34 MJ (Zhou et al. 2017).
Current usage metrics show cumulative count of Article Views (full-text article views including HTML views, PDF and ePub downloads, according to the available data) and Abstracts Views on Vision4Press platform.
Data correspond to usage on the plateform after 2015. The current usage metrics is available 48-96 hours after online publication and is updated daily on week days.
Initial download of the metrics may take a while.