Open Access
Fig. 3
Download original image
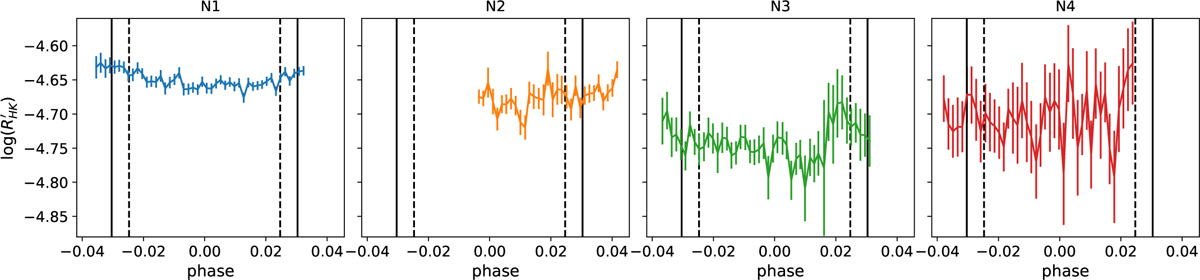
Activity indicator log ![]() as a function of the time for each night. The continuous black lines indicate the points of first and fourth contact of the transit, while the dashed black lines represent the points of second and third contact.
as a function of the time for each night. The continuous black lines indicate the points of first and fourth contact of the transit, while the dashed black lines represent the points of second and third contact.
Current usage metrics show cumulative count of Article Views (full-text article views including HTML views, PDF and ePub downloads, according to the available data) and Abstracts Views on Vision4Press platform.
Data correspond to usage on the plateform after 2015. The current usage metrics is available 48-96 hours after online publication and is updated daily on week days.
Initial download of the metrics may take a while.