Open Access
Fig. A.1
Download original image
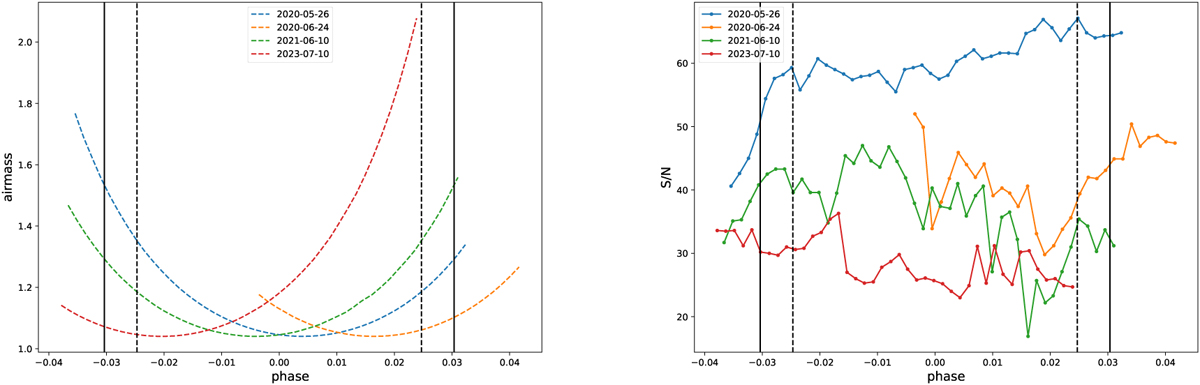
Variation of airmass (left) and S/N (right) for each night of HAT-P-67 b. The S/N was extracted from the FITS header of the HARPS-N spectra on the 53rd order, which contains the sodium feature. The continuous and the dashed vertical black lines represent the four points of contact of the transit.
Current usage metrics show cumulative count of Article Views (full-text article views including HTML views, PDF and ePub downloads, according to the available data) and Abstracts Views on Vision4Press platform.
Data correspond to usage on the plateform after 2015. The current usage metrics is available 48-96 hours after online publication and is updated daily on week days.
Initial download of the metrics may take a while.