Fig. 10
Download original image
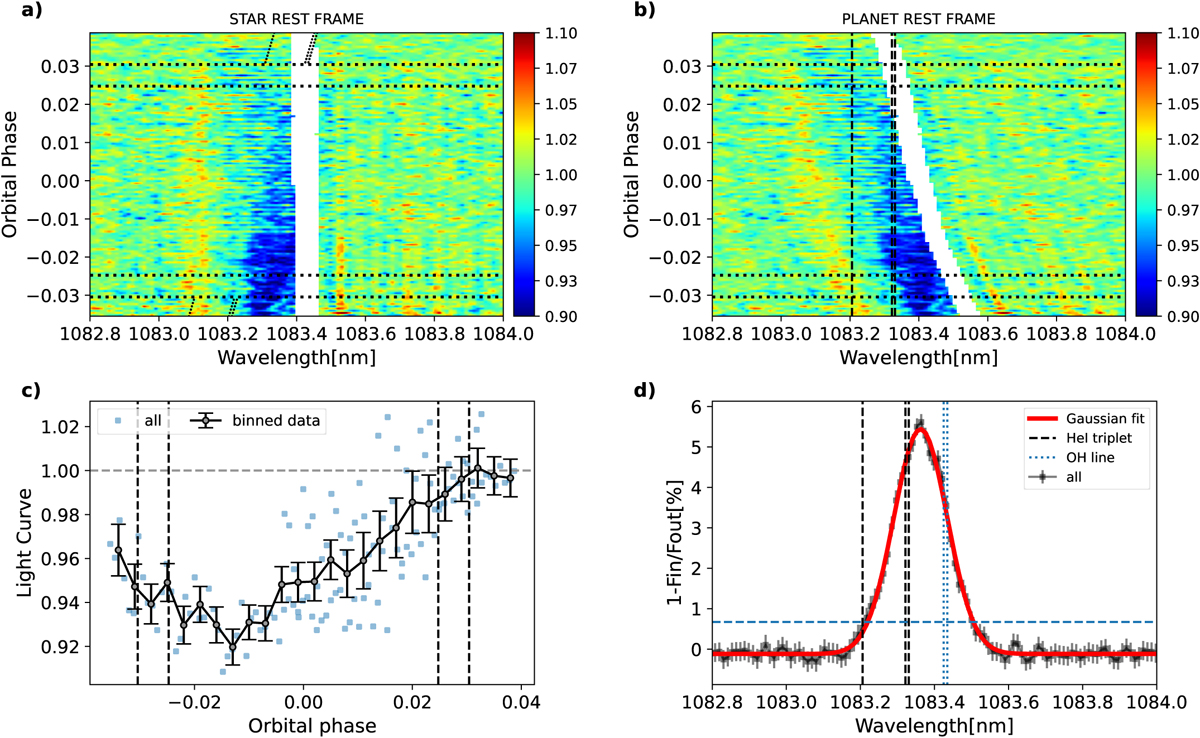
Transmission spectroscopy near the He I triplet. Panels a and b show the 2D transmission spectroscopy maps in the stellar and planet rest frames, respectively. Tilted and vertical lines denote the position of the He I triplet, while horizontal dotted lines mark the transit contact points, t1, t2, t3, and t4. Panel c shows the spectroscopic light curve computed in a 0.075 nm band centred around the peak of absorption. Vertical dashed lines mark the transit contact points. Panel d presents the full in-transit averaged transmission spectrum.
Current usage metrics show cumulative count of Article Views (full-text article views including HTML views, PDF and ePub downloads, according to the available data) and Abstracts Views on Vision4Press platform.
Data correspond to usage on the plateform after 2015. The current usage metrics is available 48-96 hours after online publication and is updated daily on week days.
Initial download of the metrics may take a while.