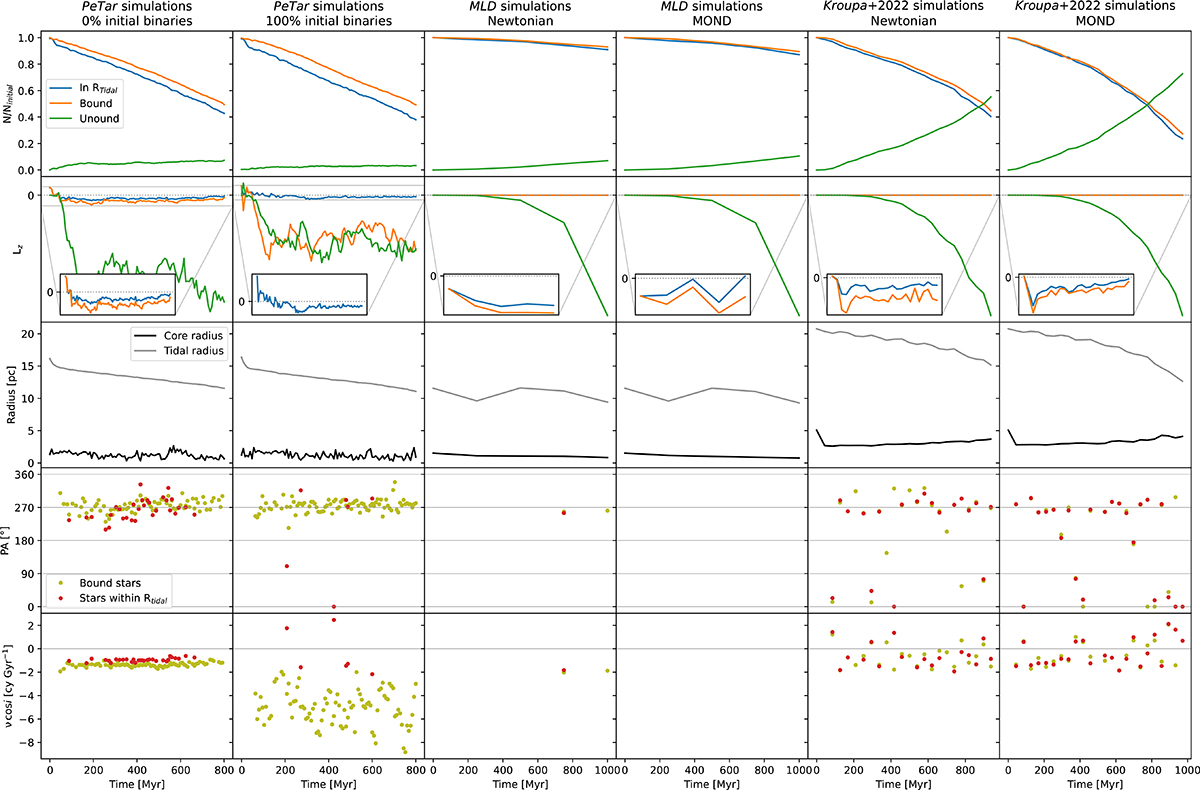
Fig. A.2.
Download original image
Evolution of the properties of simulated clusters. First row: The evolution of the number of stars which are bound (orange), unbound (green) and are within the tidal radius (blue). Here, the bound and unbound means the sum of the kinetic and potential energy of the particle is negative and positive, respectively. The numbers are normalised with respect to the total population: 5000, 5000, 2000, 2000, 50000, and 50000 for the columns from left to right, respectively. Second row: Spin angular momentum in the centre of density frame (ℒz). The ℒz values are arbitrarily scaled for visual clarity. A negative value means the cluster is spinning in the same direction as it’s orbit i.e. orbital and spin vectors are aligned. The colours are the same as the first row. Third row: Core (black) and tidal (grey) radius. Fourth row: PA (90≡counter-rotation, 270≡aligned rotation). The PA measurement for bound stars is shown in olive, while the stars within the tidal radius are shown in red. Fifth row: Spin frequency, ν cos i, for the corresponding PA.
Current usage metrics show cumulative count of Article Views (full-text article views including HTML views, PDF and ePub downloads, according to the available data) and Abstracts Views on Vision4Press platform.
Data correspond to usage on the plateform after 2015. The current usage metrics is available 48-96 hours after online publication and is updated daily on week days.
Initial download of the metrics may take a while.