Open Access
Fig. A.1.
Download original image
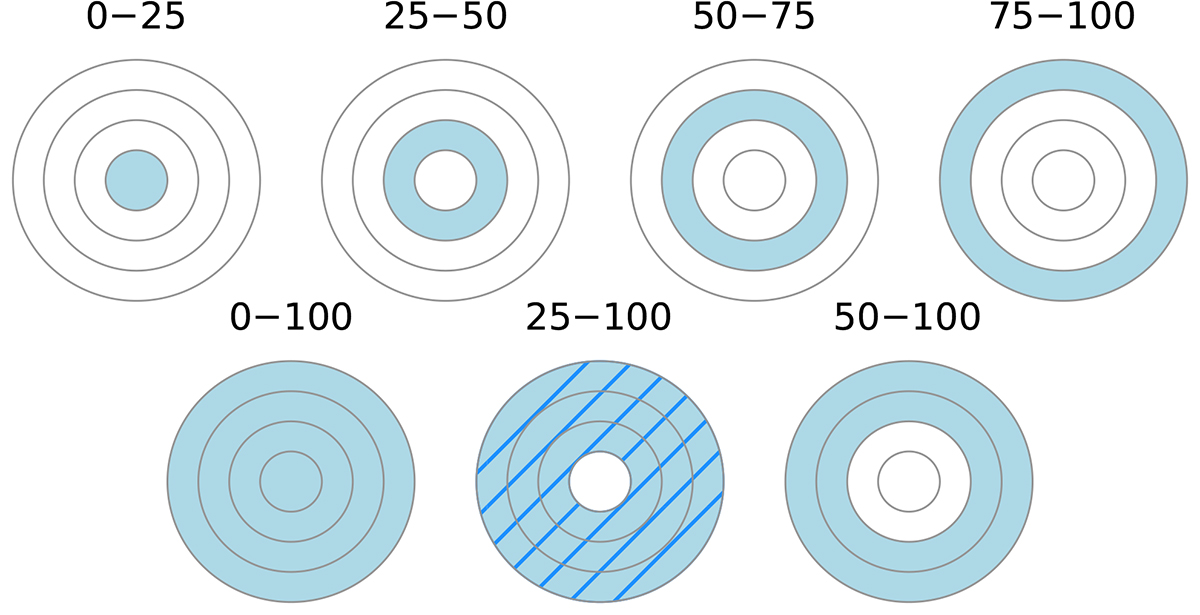
Demonstration of various radial slices used while calculating the PA. The grey circles denote the radii of the circles within which the 25th, 50th, 75th, and 100th percentiles of the members reside. The 25th–100th percentile region is used for the RV-based analysis as it avoids the noisy velocities in the cluster centre.
Current usage metrics show cumulative count of Article Views (full-text article views including HTML views, PDF and ePub downloads, according to the available data) and Abstracts Views on Vision4Press platform.
Data correspond to usage on the plateform after 2015. The current usage metrics is available 48-96 hours after online publication and is updated daily on week days.
Initial download of the metrics may take a while.