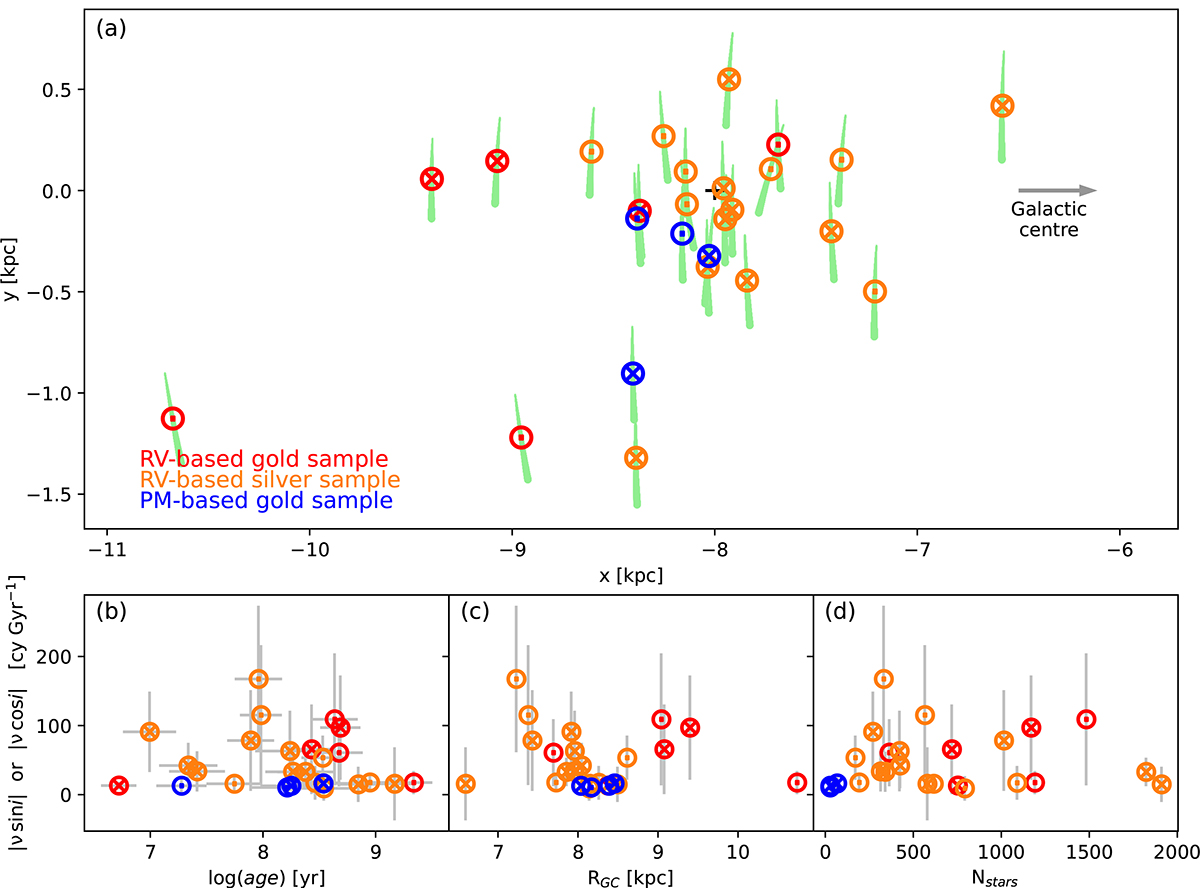
Fig. 6.
Download original image
Diagnostic plots for analysing relation between spin orientation and cluster properties. The RV-based gold sample, RV-based silver sample, and PM-based sample are shown by red, orange, and blue markers, respectively. A spin axis going into and coming out of the plane is shown as ⊗ and ⊙, respectively. (a) Galactocentric positions of clusters as seen from the Galactic north pole. The cluster orbits are shown in light green, and the Sun’s position is represented by the black cross. (b) Distribution of spin frequency with the cluster age. The RV-based method gives the ν cos i component of the spin frequency (ν), while the PM-based method gives the ν sin i component. (c) Distribution of spin frequency with the Galactocentric radius. (d) Distribution of spin frequency with the number of cluster members within the tidal radius with robust distance measurements.
Current usage metrics show cumulative count of Article Views (full-text article views including HTML views, PDF and ePub downloads, according to the available data) and Abstracts Views on Vision4Press platform.
Data correspond to usage on the plateform after 2015. The current usage metrics is available 48-96 hours after online publication and is updated daily on week days.
Initial download of the metrics may take a while.