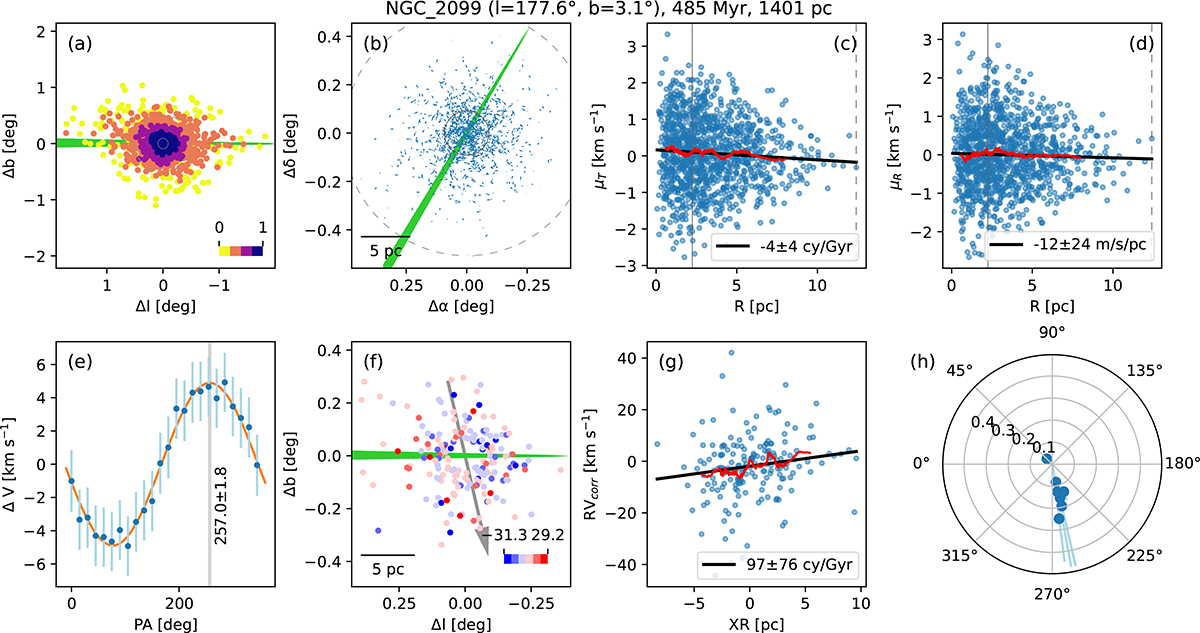
Fig. 4.
Download original image
Diagnostic plots for NGC 2099. (a) Spatial distribution of cluster members and candidates. The stars are coloured according to the membership probability. (b) The spatial distribution of stars along with arrows indicating their PM. (c) Variation of μT with radius. (d) Variation of μR with radius. (e) Variation of ΔV with PA. The PApeak is shown as a grey band, and the fitted sin curve is orange. (f) Spatial distribution of stars coloured according to RVcorr. The orbital axis corresponding to PApeak is shown as the grey arrow. (g) Distribution of RVcorr with XR. (h) Variation of PApeak for different radial slices of the cluster. The radial distance used here is the average radius of the stars within the selection, and the radial error bars show the minimum–maximum radius within the radial slice. The green wedge points towards the cluster’s orbital motion in (a), (b), and (f). The red curves show the rolling average in (c), (d), and (g). The black lines show the linear fits in (c), (d), and (g). The core radii (grey solid circle or line) and tidal radii (grey dashed circle or line) are shown in (a), (b), and (c).
Current usage metrics show cumulative count of Article Views (full-text article views including HTML views, PDF and ePub downloads, according to the available data) and Abstracts Views on Vision4Press platform.
Data correspond to usage on the plateform after 2015. The current usage metrics is available 48-96 hours after online publication and is updated daily on week days.
Initial download of the metrics may take a while.