Open Access
Fig. 2.
Download original image
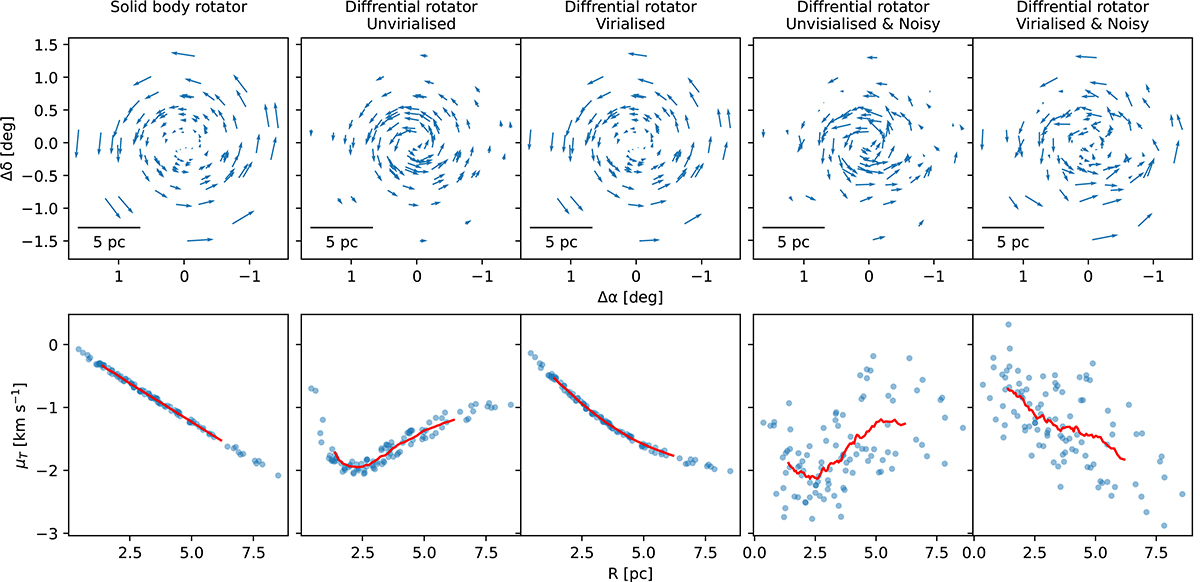
Spin detection using PM. All these clusters have 0° inclination. First row: spatial positions (Δα,Δβ) of the stars, along with the arrows indicating the PM of each star. Second row: variation of μT with radius. The red curve shows the rolling average of the μT values.
Current usage metrics show cumulative count of Article Views (full-text article views including HTML views, PDF and ePub downloads, according to the available data) and Abstracts Views on Vision4Press platform.
Data correspond to usage on the plateform after 2015. The current usage metrics is available 48-96 hours after online publication and is updated daily on week days.
Initial download of the metrics may take a while.