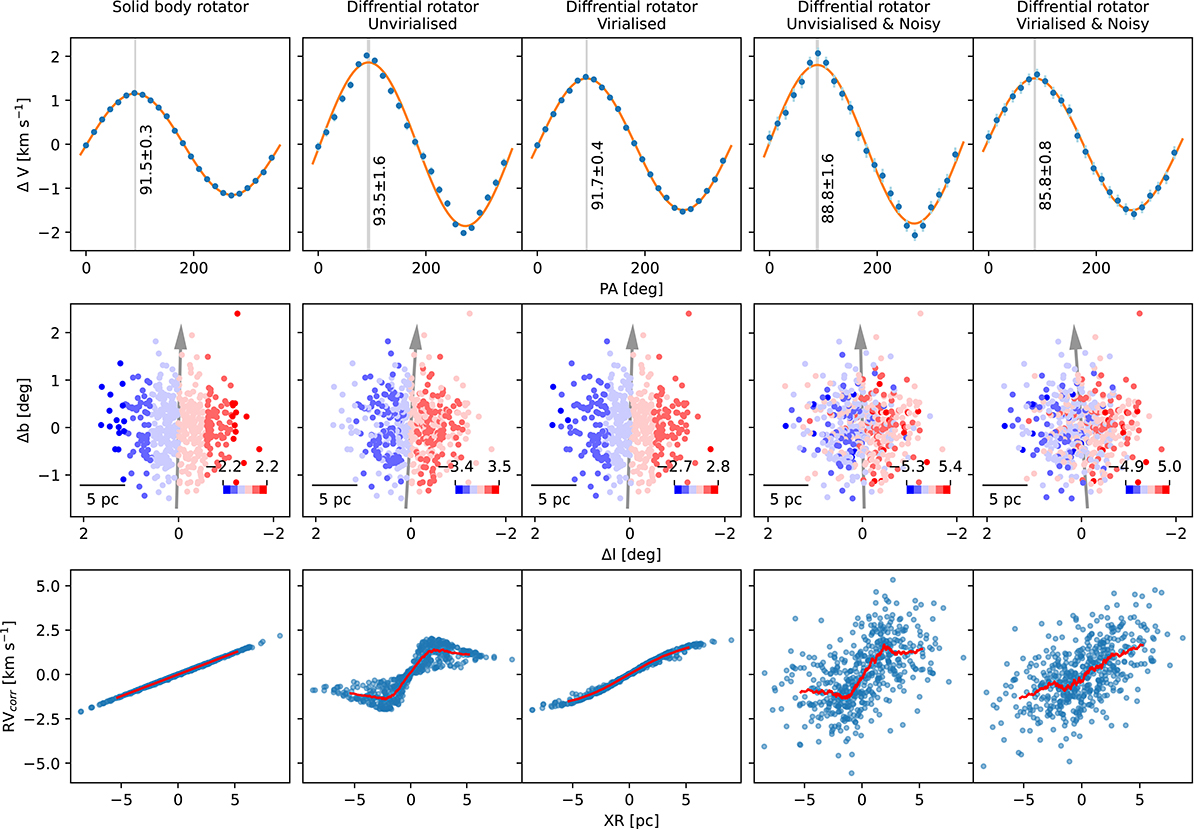
Fig. 1.
Download original image
Spin detection using RV. All these clusters have 90° inclination. First row: variation of ΔV across various PA. The fitted sin curve is shown in orange, while the grey bar shows the PApeak. Second row: spatial positions (Δl,Δb) of the stars coloured according to their RV. The identified spin axis (corresponding to PApeak) is shown in grey. Third row: variation of RVcorr with XR. The red curve shows the rolling average of the RVcorr values.
Current usage metrics show cumulative count of Article Views (full-text article views including HTML views, PDF and ePub downloads, according to the available data) and Abstracts Views on Vision4Press platform.
Data correspond to usage on the plateform after 2015. The current usage metrics is available 48-96 hours after online publication and is updated daily on week days.
Initial download of the metrics may take a while.