Fig. 9
Download original image
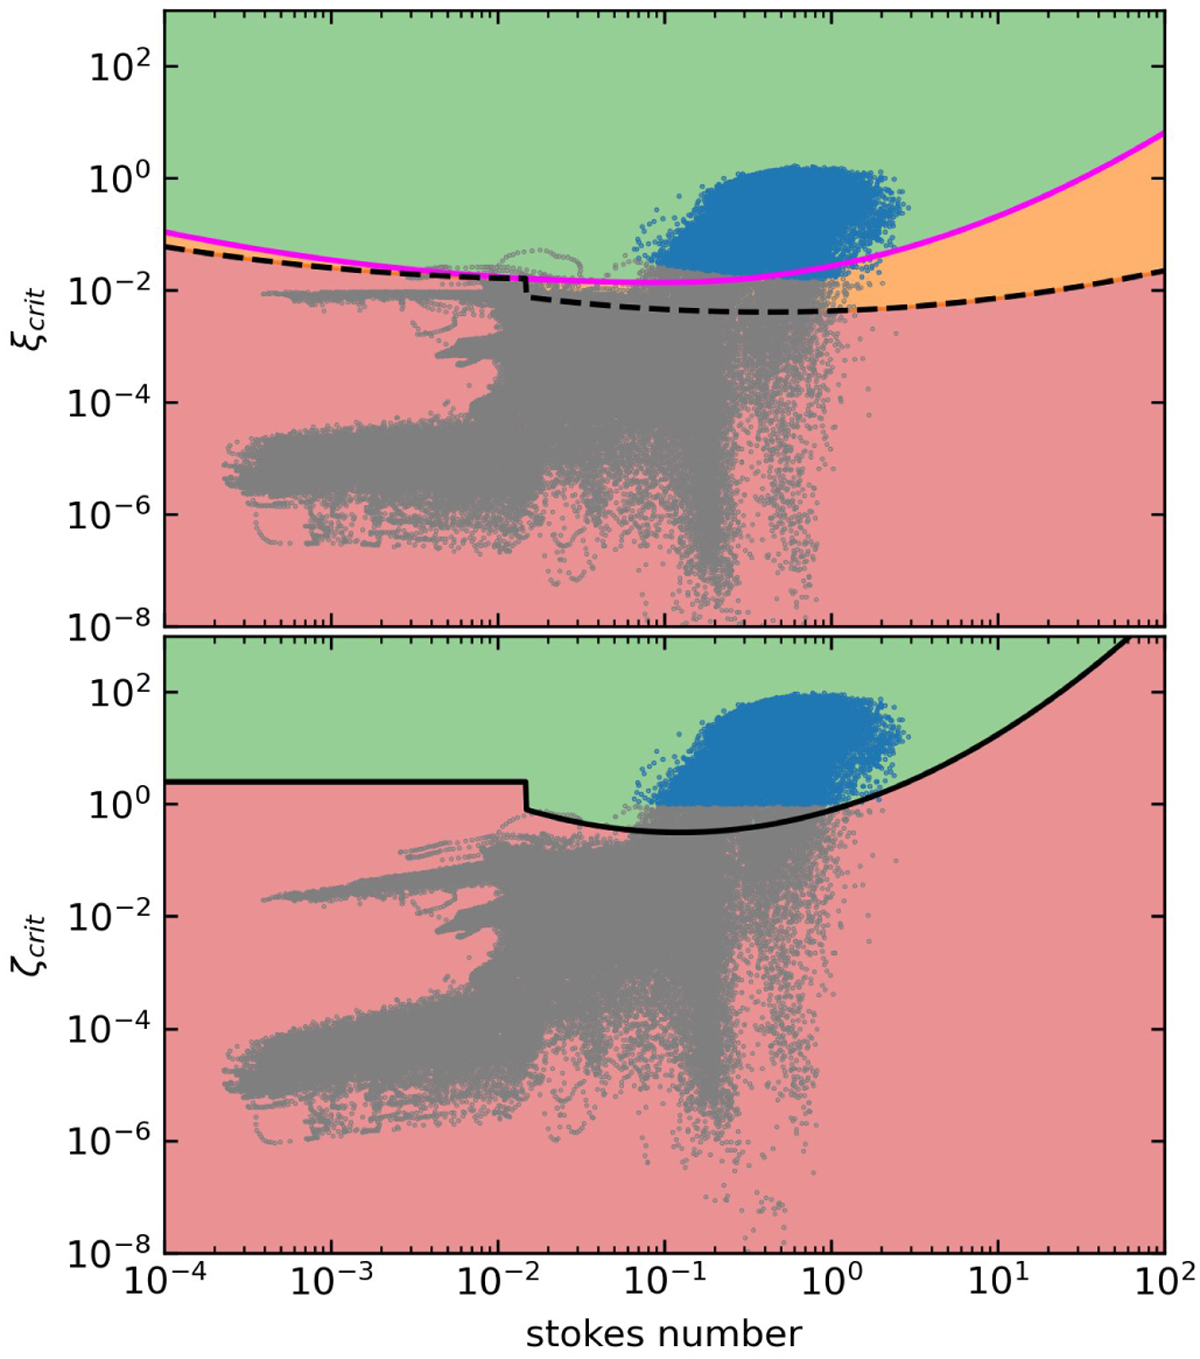
Streaming instability phase space. The top panel shows the ratio of the surface densities of grown dust to gas as a function of the Stokes number. The pink and dashed black lines depict the critical values for the development of the streaming instability according to Yang et al. (2017) and Li & Youdin (2021). The data of the fiducial model are overlaid with filled circles, with blue ones fulfilling in addition the criterion on the ratio of volume densities (see Eq. (28)). The bottom panel shows panel displaces the ratio of the volume densities of grown dust to gas as a function of St. The solid black line indicates the critical values for the streaming instability according to Eq. (30). The fiducial model data are overlaid with the grey circles.
Current usage metrics show cumulative count of Article Views (full-text article views including HTML views, PDF and ePub downloads, according to the available data) and Abstracts Views on Vision4Press platform.
Data correspond to usage on the plateform after 2015. The current usage metrics is available 48-96 hours after online publication and is updated daily on week days.
Initial download of the metrics may take a while.