Fig. 8
Download original image
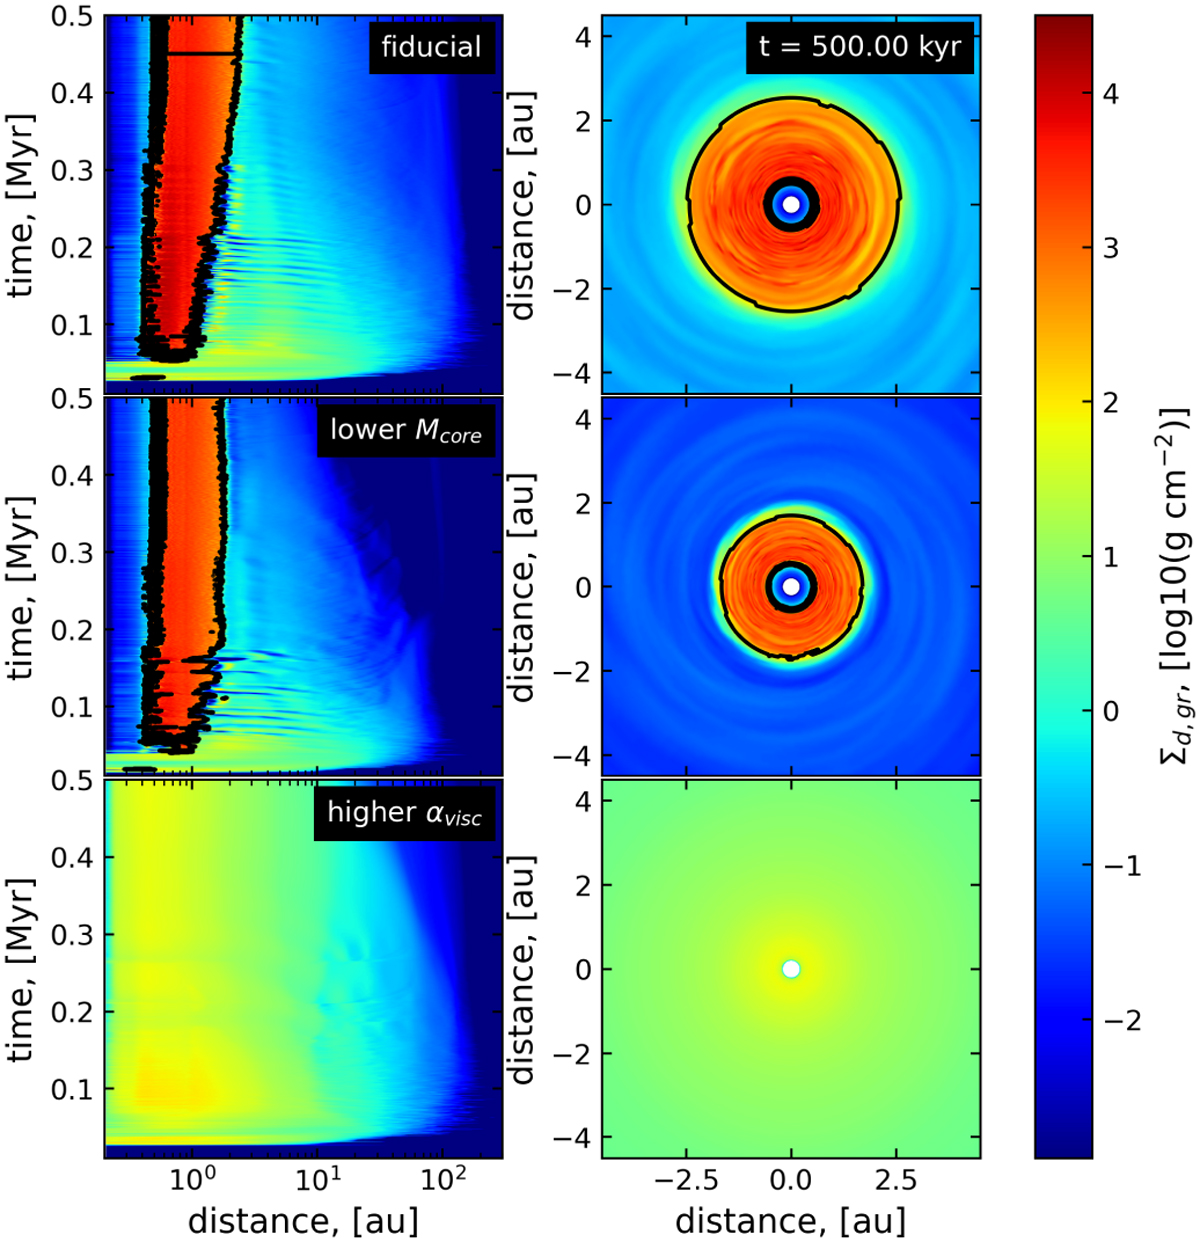
Surface density of grown dust with the disk regions susceptible to the streaming instability identified by the black curves. The rows from top to bottom correspond to the fiducial model, model with a lower mass of the prestellar core, and model with a higher value of the viscous parameter. The left column shows the time-dependent evolution of the azimuthally averaged Σd,gr , while the right column presents the two-dimensional distribution of Σd,gr in the inner 10 × 10 au box at the end of simulations.
Current usage metrics show cumulative count of Article Views (full-text article views including HTML views, PDF and ePub downloads, according to the available data) and Abstracts Views on Vision4Press platform.
Data correspond to usage on the plateform after 2015. The current usage metrics is available 48-96 hours after online publication and is updated daily on week days.
Initial download of the metrics may take a while.